. 2013;8(2):e55820.
doi: 10.1371/journal.pone.0055820. Epub 2013 Feb 20.

Bmi1 enhances tumorigenicity and cancer stem cell function in pancreatic adenocarcinoma

Affiliations

Bmi1 enhances tumorigenicity and cancer stem cell function in pancreatic adenocarcinoma

Erica Proctor et al. PLoS One. 2013.

Abstract

Background: Bmi1 is an integral component of the Polycomb Repressive Complex 1 (PRC1) and is involved in the pathogenesis of multiple cancers. It also plays a key role in the functioning of endogenous stem cells and cancer stem cells. Previous work implicated a role for cancer stem cells in the pathogenesis of pancreatic cancer. We hypothesized that Bmi1 plays an integral role in enhancing pancreatic tumorigenicity and the function of cancer stem cells in pancreatic ductal adenocarcinoma.

Methods: We measured endogenous Bmi1 levels in primary human pancreatic ductal adenocarcinomas, pancreatic intraepithelial neoplasias (PanINs) and normal pancreas by immunohistochemistry and Western blotting. The function of Bmi1 in pancreatic cancer was assessed by alteration of Bmi1 expression in several cell model systems by measuring cell proliferation, cell apoptosis, in vitro invasion, chemotherapy resistance, and in vivo growth and metastasis in an orthotopic model of pancreatic cancer. We also assessed the cancer stem cell frequency, tumorsphere formation, and in vivo growth of human pancreatic cancer xenografts after Bmi1 silencing.

Results: Bmi1 was overexpressed in human PanINs, pancreatic cancers, and in several pancreatic cancer cell lines. Overexpression of Bmi1 in MiaPaCa2 cells resulted in increased proliferation, in vitro invasion, larger in vivo tumors, more metastases, and gemcitabine resistance while opposite results were seen when Bmi1 was silenced in Panc-1 cells. Bmi1 was overexpressed in the cancer stem cell compartment of primary human pancreatic cancer xenografts. Pancreatic tumorspheres also demonstrated high levels of Bmi1. Silencing of Bmi1 inhibited secondary and tertiary tumorsphere formation, decreased primary pancreatic xenograft growth, and lowered the proportion of cancer stem cells in the xenograft tissue.

Conclusions: Our results implicate Bmi1 in the invasiveness and growth of pancreatic cancer and demonstrate its key role in the regulation of pancreatic cancer stem cells.


Conflict of interest statement

Competing Interests: The authors have declared that no competing interests exist.

Figures

Figure 1
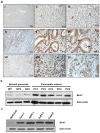
Figure 1. Bmi1 is overexpressed in PanIN lesions, pancreatic adenocarcinomas, and pancreatic cancer cell lines.
A. Immunohistochemistry for Bmi1 expression was performed on pancreas tissue specimens with varying degrees of dysplasia ranging from normal (n = 10) through PanIN (n = 16) to invasive adenocarcinoma of the pancreas (n = 10). As negative controls, we subjected tissue specimens to the staining procedure in the absence of specific Bmi1 antibody (1∶100, Cell signaling). The images were captured at 10x, 40x, and 60x magnification. Representative images show few cells expressing Bmi1in normal pancreas tissue (i, ii, iii), high levels of expression in PanIN lesions (iv, v, vi), and significant overexpression in adenocarcinoma (vii, viii, ix). B. Western blot analysis of Bmi1 expression in normal pancreas lysates (n = 10) and pancreatic cancer tissue lysates (n = 10) from different patients was performed. Bmi1 is overexpressed in tumor lysates compared to normal pancreas tissue controls. Beta actin was used as the loading control. C. Endogenous Bmi1 expression in pancreatic cancer cell lines was determined by Western blot analysis. β-actin served as a loading control.
Figure 2
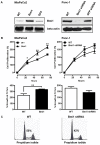
Figure 2. Altered Bmi1 expression affects cell proliferation in vitro.
A. Bmi1 protein expression was analyzed following transfection of MiaPaCa2 (top) and Panc-1 (bottom) pancreatic cancer cells with a lentiviral vector (Bmi1) encoding Bmi1 or Bmi1 shRNA (Bmi1 shRNA) as described previously . A lentiviral vector expressing GFP (GFP) or control shRNA was used as negative control. B. In vitro cell proliferation of MiaPaCa2 cells (left) and Panc-1 cells (right) following modulation of Bmi1 expression was assessed by the MTS assay (Promega, Madison, WI). Cell replication was recorded as calculated percent proliferation increase derived from reagent uptake at time (t) minus basal reagent uptake at day 0. Bottom panels show the observed changes in proliferation 72 hours after plating. Data are expressed as the mean ± SEM. * p<0.05, ** p<0.0001, n = 6 independent experiments. C. Representative cell cycle histograms following flow cytometric analysis of propidium iodide (PI) stained Panc-1 cells show reduction in the percentage of cells entering S-phase upon Bmi1 expression inhibition.
Figure 3
Figure 3. Bmi1 expression alters in vitro pancreatic cancer cell invasion and induces a chemoresistant phenotype.
A. Overexpression of Bmi1 in MiaPaCa2 cells enhances their invasiveness in in vitro Matrigel invasion assays (left panel). In contrast, Bmi1 downregulation in Panc-1 cells leads to decreased tumor cell invasion (right panel). Data are expressed as the mean ± SEM. * p<0.0003, ** p<0.004, n = 6 independent experiments. B. Overexpression of Bmi1 in MiaPaCa2 cells leads to upregulation of the EMT markers vimentin, and ZEB1, while downregulation of Bmi1 in Panc-1 cells leads to reduced expression of EMT markers. Data are expressed as the mean± SEM compared to control cells (* p<0.005). C. Cell survival of GFP or Bmi1 transfected MiaPaCa2 cells (left) following treatment with gemcitabine for 48 hrs. Data was recorded as fold change over control untreated group and expressed as the mean ± SEM (* p<0.05 vs control). q-RT-PCR analysis of MRP5 expression in GFP or Bmi1 transfected MiaPaCa2 cells (right) following gemcitabine treatment. Data are normalized to GAPDH and expressed as the mean ± SEM (* p<0.05 vs control).
Figure 4
Figure 4. Modulation of Bmi1 expression affects tumor growth and invasion in vivo.
A. Representative images shown demonstrate relative tumor size difference at 28 days following orthotopic pancreas implantation of MiaPaCa2 (top) and Panc-1 cells (bottom) in NOD-SCID mice after modulating Bmi1 expression. The tumor volume was calculated by using the formula for volume of an ellipsoid structure (4/3 * π * width/2 * length/2 * height/2). Data are expressed as the mean ± SEM (* p<0.05, n = 5 independent experiments). B. The image shown is representative of enhanced metastatic potential in MiaPaCa2 cells following induced expression of Bmi1. * Marked sites show gross metastasis of MiaPaCa2 tumor to extrapancreatic sites in NOD-SCID mice 28 days following orthotopic injection of cells.
Figure 5
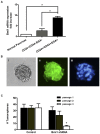
Figure 5. Bmi1 is overexpressed in pancreatic cancer stem cells and regulates their self-renewal.
A. CD44+/CD24+/ESA+ cells were isolated using flow cytometry from pancreatic cancer tissues as described previously . Total RNA was isolated and mRNA was quantitated by q- RT-PCR in normal pancreas, bulk CD44/CD24/ESA- pancreatic cancer cells and CD44+/CD24+/ESA+ pancreatic cancer cells. Data are expressed as the mean ± SEM (* p<0.05, n = 3 independent experiments, each performed in triplicate). B. Immunofluorescent staining of Bmi1 in tumorspheres formed from CD44+/CD24+/ESA+ cells. C. Silencing Bmi1 inhibits the ability of CD44+/CD24+/ESA+ cells to form spheres with serial passaging. Data are expressed as the mean ± SEM (* p<0.05, n = 3 independent experiments, each performed in triplicate).
Figure 6
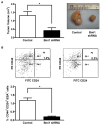
Figure 6. Silencing of Bmi1 decreases tumor growth and CD44+/CD24+/ESA+ cell numbers in tumor xenografts.
A. Silencing of Bmi1 inhibits tumor proliferation. Representative photograph (top) of tumor xenografts shown. Left – control tumor, right – Bmi1 silenced tumor. Bar graph shows tumor volume difference at 28 days. Data are expressed as the mean ± SEM (* p<0.05, n = 4 independent experiments). B. Silencing of Bmi1 directly impacts CSC number in tumor xenografts. Representative flow cytometry plots (top) of CD44+/CD24+/ESA+ cell numbers in control (left) and Bmi1 silenced (right) xenografts at 28 days. Bar graph (bottom) quantifies CSC numbers in xenografts at 28 days following silencing of Bmi1. Data are expressed as the mean ± SEM (* p = 0.0007, n = 4 independent experiments).

References

    1. SEER website. Available: http://seer.cancer.gov/csr/1975_2009_pops09/results_single/sect_01_table.... Accessed 2013 Jan 1.
    1. Haupt Y, Bath ML, Harris AW, Adams JM (1993) bmi-1 transgene induces lymphomas and collaborates with myc in tumorigenesis. Oncogene 8: 3161–3164. - PubMed
    1. van Lohuizen M, Verbeek S, Scheijen B, Wientjens E, van der Gulden H, et al. (1991) Identification of cooperating oncogenes in E mu-myc transgenic mice by provirus tagging. Cell 65: 737–752. - PubMed
    1. Jacobs JJ, Kieboom K, Marino S, DePinho RA, van Lohuizen M (1999) The oncogene and Polycomb-group gene bmi-1 regulates cell proliferation and senescence through the ink4a locus. Nature 397: 164–168. - PubMed
    1. Jacobs JJ, Scheijen B, Voncken JW, Kieboom K, Berns A, et al. (1999) Bmi-1 collaborates with c-Myc in tumorigenesis by inhibiting c-Myc-induced apoptosis via INK4a/ARF. Genes Dev 13: 2678–2690. - PMC - PubMed

Publication types

MeSH terms