. 2013;8(2):e56500.
doi: 10.1371/journal.pone.0056500. Epub 2013 Feb 21.

Expression and purification of functional human mu opioid receptor from E.coli

Affiliations

Expression and purification of functional human mu opioid receptor from E.coli

Yanbin Ma et al. PLoS One. 2013.

Abstract

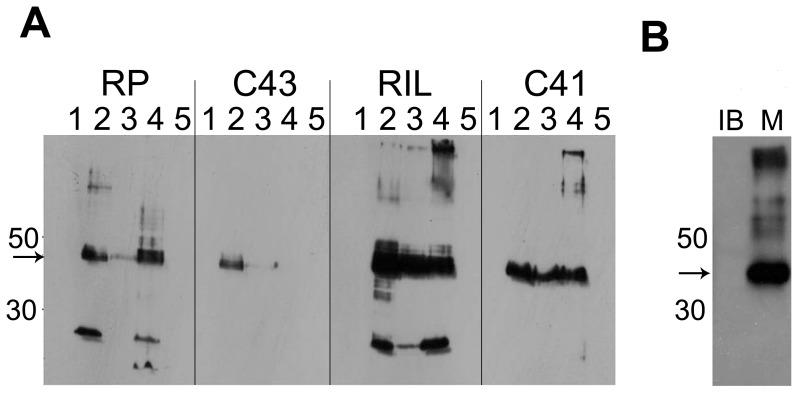
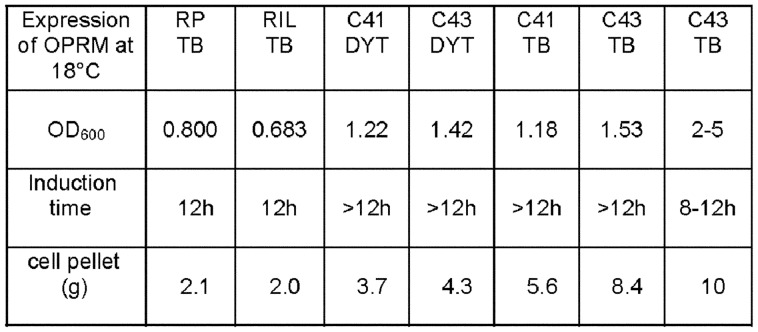
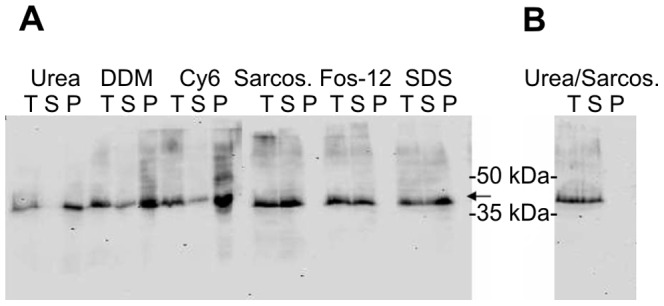
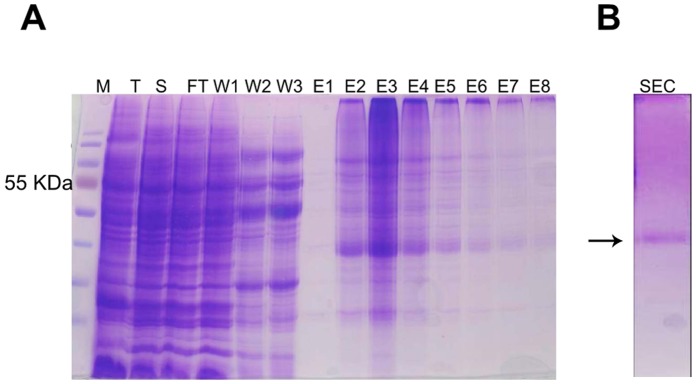
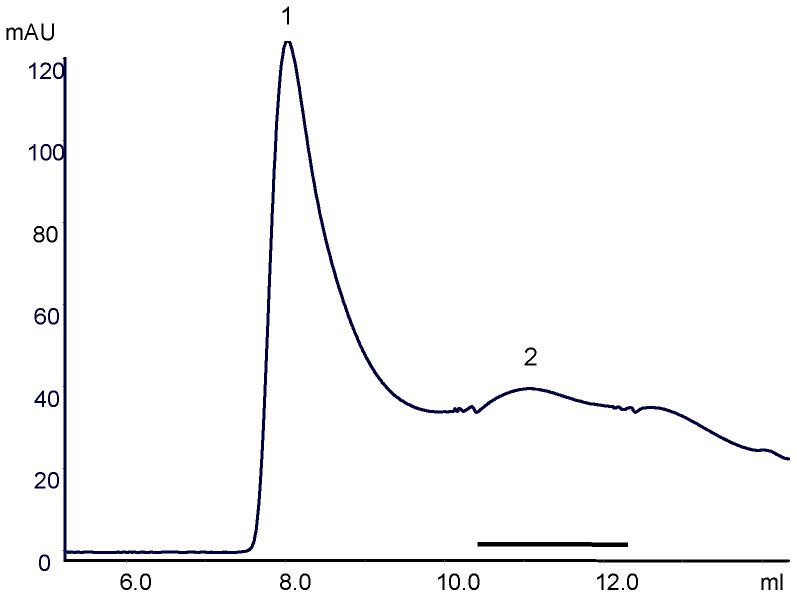
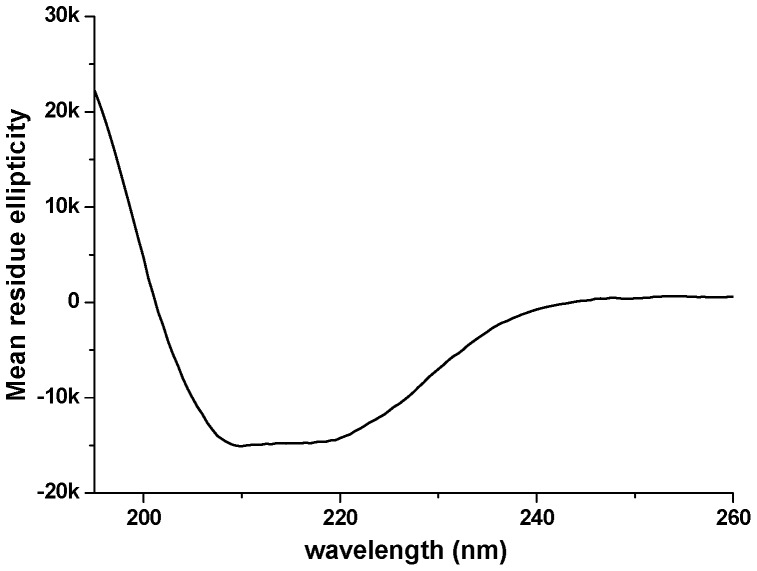
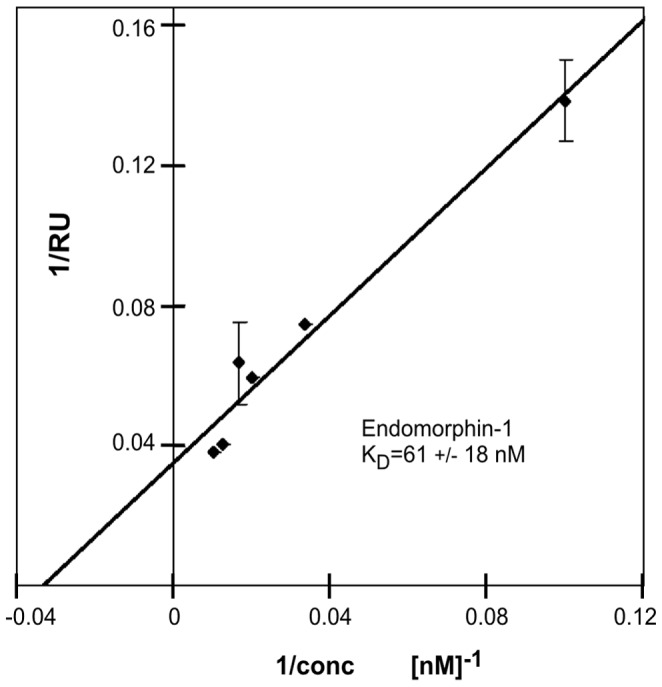
N-terminally his-tagged human mu opioid receptor, a G protein-coupled receptor was produced in E.coli employing synthetic codon-usage optimized constructs. The receptor was expressed in inclusion bodies and membrane-inserted in different E.coli strains. By optimizing the expression conditions the expression level for the membrane-integrated receptor was raised to 0.3-0.5 mg per liter of culture. Milligram quantities of receptor could be enriched by affinity chromatography from IPTG induced cultures grown at 18°C. By size exclusion chromatography the protein fraction with the fraction of alpha-helical secondary structure expected for a 7-TM receptor was isolated, by CD-spectroscopy an alpha-helical content of ca. 45% was found for protein solubilised in the detergent Fos-12. Receptor in Fos-12 micelles was shown to bind endomorphin-1 with a K(D) of 61 nM. A final yield of 0.17 mg functional protein per liter of culture was obtained.


Conflict of interest statement

Competing Interests: JK was an employee of QIAGEN, which sells products related to membrane proteins. JL and JK are co-inventors of a PCT patent application (number WO2010037510) by Research Center Jülich and Qiagen GmbH related to the crystallisation of membrane proteins. This does not alter the authors’ adherence to all the PLOS ONE policies on sharing data and materials.

Figures

Figure 1
Figure 1. Expression of the N-terminally his-tagged OPRM protein.
Western blot on His-tag. A, Expression by autoinduction at 37°C in different E.coli strains (RP, RIL, C41, and C43). Lane 1 - uninduced, lane 2–Inclusion body fraction (induced 4 h), lane 3–Membrane fraction (induced 4 h), lane 4–Inclusion body fraction (induced 20 h), lane 5–Membrane fraction (induced 20 h). B, Optimised expression of OPRM using C43 cells, TB medium with 0.4 mM IPTG at 18°C. Western blot showed inclusion body (IB) and membrane fractions (M) of OPRM.
Figure 2
Figure 2. Growth conditions of OPRM in different E.coli strains.
Expression of OPRM was induced by IPTG. Cell culture density (OD600) and weight of cell pellet (g) after different induction times with two different media (TB and DYT) was measured. Cell pellet (g) was obtained from 1 liter of culture medium.
Figure 3
Figure 3. Solubilisation of OPRM with detergents.
A, solubilisation with urea or detergents. B, solubilisation with urea and laurylsarcosine. T -total membrane fraction, S -solubilised membrane fraction, P -pellet after solubilisation.
Figure 4
Figure 4. Purification of OPRM from C43 in Fos-12.
A, Purification of OPRM solubilised with Fos-12 by Ni-NTA. T -total membrane fraction, S -solubilised membrane fraction, FT -flowthrough. W – wash fractions (25 mM imidazole), E – elution fractions (300 mM imidazole). The arrow denotes the monomeric OPRM. B, SEC -purified OPRM after size exclusion chromatography.
Figure 5
Figure 5. Size exclusion chromatography of OPRM in Fos-12.
Purification of OPRM was performed in analytical grade Superdex 200 HR 10/30 size exclusion chromatography. Peak 1 identifies the aggregation of OPRM. The underlined Peak 2 shows the monomeric form of OPRM.
Figure 6
Figure 6. Mass spectrometry of OPRM.
Sequence coverage of trypsin digested peptide fragments identified. MS/MS spectrum of an identified peptide fragment EFCIPTSSNIEQQNSTR and OPRM sequence with identified fragments in red.
Figure 7
Figure 7. Secondary structural analysis of purified OPRM protein.
The Circular dichroism spectrum of OPRM at 25°C. Mean residue ellipticity [θ] in degrees×cm2×dmol−1.
Figure 8
Figure 8. Interaction of OPRM with Endomorphin-1 by Surface Plasmon Resonance (SPR).
SPR shows the apparent association increases in RU response with the addition of EM-1 at 25°C. The binding constant (KD) of EM-1 to OPRM was obtained from (Rmax-R)*C/R, where C is concentration of EM-1, total concentration of OPRM is proportional to maximum binding capacity Rmax, Concentration of complex is measured directly as Response Unit in R. A KD of 60.9±18.1 nM for EM-1 was determined by fitting the data with a 1∶1 interaction model. Error bars represent values of two duplicates.

References

    1. Flower DR (1999) Modelling G-protein-coupled receptors for drug design. Biochim Biophys Acta 1422: 207–234. - PubMed
    1. Fredriksson R, Lagerstrom MC, Lundin LG, Schioth HB (2003) The G-protein-coupled receptors in the human genome form five main families. Phylogenetic analysis, paralogon groups, and fingerprints. Mol Pharmacol 63: 1256–1272. - PubMed
    1. Schlyer S, Horuk R (2006) I want a new drug: G-protein-coupled receptors in drug development. Drug Discov Today 11: 481–493. - PubMed
    1. Takeda S, Kadowaki S, Haga T, Takaesu H, Mitaku S (2002) Identification of G protein-coupled receptor genes from the human genome sequence. FEBS Lett 520: 97–101. - PubMed
    1. Tyndall JD, Sandilya R (2005) GPCR agonists and antagonists in the clinic. Med Chem 1: 405–421. - PubMed

Publication types

MeSH terms