. 2013;8(2):e56586.
doi: 10.1371/journal.pone.0056586. Epub 2013 Feb 20.

Imatinib ameliorates neuroinflammation in a rat model of multiple sclerosis by enhancing blood-brain barrier integrity and by modulating the peripheral immune response

Imatinib ameliorates neuroinflammation in a rat model of multiple sclerosis by enhancing blood-brain barrier integrity and by modulating the peripheral immune response

Milena V Adzemovic et al. PLoS One. 2013.

Erratum in

Abstract

Central nervous system (CNS) disorders such as ischemic stroke, multiple sclerosis (MS) or Alzheimers disease are characterized by the loss of blood-brain barrier (BBB) integrity. Here we demonstrate that the small tyrosine kinase inhibitor imatinib enhances BBB integrity in experimental autoimmune encephalomyelitis, an animal model of multiple sclerosis (MS). Treatment was accompanied by decreased CNS inflammation and demyelination and especially reduced T-cell recruitment. This was supported by downregulation of the chemokine receptor (CCR) 2 in CNS and lymph nodes, and by modulation of the peripheral immune response towards an anti-inflammatory phenotype. Interestingly, imatinib ameliorated neuroinflammation, even when the treatment was initiated after the clinical manifestation of the disease. We have previously shown that imatinib reduces BBB disruption and stroke volume after experimentally induced ischemic stroke by targeting platelet-derived growth factor receptor -α (PDGFR-α) signaling. Here we demonstrate that PDGFR-α signaling is a central regulator of BBB integrity during neuroinflammation and therefore imatinib should be considered as a potentially effective treatment for MS.


Conflict of interest statement

Competing Interests: The authors have declared that no competing interests exist.

Figures

Figure 1
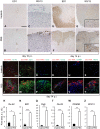
Figure 1. Imatinib enhances BBB integrity during EAE.
(A, B) Extravasation of 70 kDa dextran in wholemount thoracic and lumbar spinal cord portions on day 10 and 14 p.i. Imatinib-treated rats exhibited less extravasation on both time-points, compared to PBS controls. Tracer-injected naive rat is shown as negative control. (C) Dextran extravasation in spinal cord cross-sections. PBS-treated rats showed distinct meningeal permeability on day 10 p.i., which was not observed in the imatinib-treated animals. On day 14 p.i., imatinib-treated rats showed less signs of BBB disruption in contrast to profound extravasation in the meninges and perivascular space in both gray and white matter of the control spinal cords (white arrows). (D) Quantification of vascular permeability on day 10 and 14 p.i. based on red fluorescent pixel area recorded in spinal cord sections and wholemounts (n = 5 rats/experimental group/time-point). Scale bars, 1 mm (A, B) and 50 µm (C). Error bars, S.E.M. Statistics were calculated using t-test and P values <0.05 were considered significant. P<0.05 = *, P<0.01 = **, P<0.001 = ***. IHC analysis of paraffin embedded spinal cord tissue sections on day 10 p.i. (E–H) and 14 p.i. (I–P). α-dysferlin was used for detecting permeable CNS vasculature and α-occludin for detecting the tight junction components. (E–H) Healthy animals from both groups were compared on day 10 p.i. (n = 8 rats/experimental group; representative images shown). Almost total absence of dysferlin+ blood vessels observed in the spinal cord gray matter of the imatinib group (E), while PBS controls exhibited dysferlin+ vessels more frequently (F). Occludin+ blood vessels were rarely detectable in both groups (G, H). (I–P) On day 14 p.i. (n = 5 rats/experimental group; representative images shown), spinal cord tissues from the same anatomical positions undergoing EAE from both groups were compared. Demyelinated lesions and lesion-associated blood vessels in the imatinib-treated rats expressed predominantly occludin (K, O), while dysferlin upregulation prevailed in the lesions of the PBS controls (J, N). Scale bars, 100 µm (E–H, M–P), 250 µm (I–L). Imatinib or PBS oral gavage was performed from day 5 p.i until the end of the experiment (A–P).
Figure 2
Figure 2. Imatinib reduces infiltration of immune cells and attenuates microglia activation.
IHC analysis on paraffin embedded spinal cord tissue cross-sections on day 10 p.i. (A–D; n = 8 rats/experimental group; representative images shown) and 14 p.i. (E–H; n = 5 rats/experimental group; representative images shown). Although showing no sign of CNS inflammation and demyelination, control animals already started recruiting W3/13+ T-cells (B) and ED1+ macrophages (D) to the meninges and in the perivascular space, whereas the imatinib-treated group showed a delay in recruitment of inflammatory cells to the CNS. On day 14 p.i., spinal cords of the imatinib-treated rats exhibiting demyelinated lesions recruited lower amounts of W3/13+ T-cells (G, H) while ED1+ macrophages infiltration was similar to the controls (E, F). Scale bar, 200 µm (A–H). (I–Z) IF performed on spinal cord cross-sections of rats injected with fluorescent tracer (dextran, red) on day 14 p.i. α-Ox-42, ED1, Ox-6, Ox-22, CD45RA and W3/13 antibody staining (all in green) in imatinib- (I, L, O, R, U, X) and PBS-treated rats (J, M, P, S, V, Y). (I–K) Microglia activation was significantly decreased in the imatinib-treated rats, while Ox-42+ cells were detectable around leaky blood vessels (asterix) in the control tissue. (L–N) The amount of macrophages/activated microglia cells was significantly decreased in the spinal cords of the imatinib-treated rats. (O–Q) Significantly lower amounts of MHC class II+ cells were found in the meninges and parenchyma of the imatinib-treated rats vs. PBS controls. (R–Z) Significantly lower amounts of Ox-22+, CD45RA+ and W3/13+ cells were found in the meninges and parenchyma of the imatinib-treated rats vs. PBS controls (R, U, X vs. S, V, Y). Quantifications of Ox-42, ED1, Ox-6, Ox-22, CD45RA and W3/13 expression based on green fluorescent pixel area quantifications from spinal cord cross-sections (K, N, Q, T, W, Z). n = 5 rats/experimental group. Scale bar, 50 µm. Error bars, S.E.M. Statistics were calculated using t-test and P values <0.05 were considered significant (P<0.05 = *, P<0.01 = **, P<0.001 = ***). Imatinib or PBS oral gavage was performed from day 5 p.i until the end of the experiment.
Figure 3
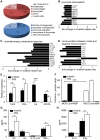
Figure 3. Imatinib suppresses the peripheral immune response.
(A–D) Genome wide expression array analysis performed on inguinal lymph node cells harvested from imatinib-treated and control rats on day 10 p.i. (Affymetrix 1.0 ST. 3' arrays; n = 6 arrays/experimental group). (A) Functional annotations differentially regulated between imatinib and PBS-treated rats. Immune cell trafficking was profoundly downregulated in the imatinib group (red pie-chart), as well as numerous immune functions (blue pie-chart). Numbers indicate the amount of molecules differentially expressed in the certain biological function. (B–D) Canonical pathways most significantly affected by imatinib treatment. Leucocyte extravasation was downregulated in the imatinib-treated rats, especially matrix metalloproteinases and CXCR3 (B). The anti-inflammatory interleukine response is also downregulated in the imatinib group in contrast to controls (C). The communication between the innate and adaptive immune response, especially Toll-like receptor (Tlr) signaling is generally downregulated in the imatinib group (D). Statistics are calculated using t-test and calculated P values indicated high significance for each presented molecule P<0.00001 = ***). Error bars (not visible), S.E.M. (E) Gene expression profiling in inguinal lymph nodes day 10 p.i. by qPCR. mRNA transcript levels for Th2-cell lineage proliferation: IL4 and STAT6 are higher in imatinib-treated rats., whereas control rats showed elevated mRNA levels for TLR2 and CD4 transcripts (n = 8 rats/experimental group, both inguinal lymph nodes/animal). (F) MOG-induced IFNγ Elispot analysis on imatinib-treated and control rat spleenocytes harvested on day 10 p.i. ConA used as a positive control, MBP as an unspecific antigen (n = 4 rats/experimental group). Imatinib-treated rats had significantly lower number of proliferating MOG specific T-cells comparing to the controls. (G–H) MOG re-stimulation assay with spleenocytes harvested from imatinib-treated or control mice on day 7 p.i. (n = 4 mice/experimental group). Levels of Th1/Th2 specific cytokines measured after three days in vitro culturing in the presence of MOG, MBP or ConA. (A–F) Imatinib or PBS oral gavage was performed from day 5 p.i until the end of the experiment. (G–H) Imatinib or PBS oral gavage was performed from day 2 p.i until the end of the experiment Error bars, S.E.M. Statistics were calculated using t-test and P values <0.05 were considered significant (P<0.05 = *, P<0.01 = **, P<0.001 = ***).
Figure 4
Figure 4. Imatinib downregulates CCR2 expression in the CNS during EAE.
(A–D) IHC analysis of CCR2 expression (in brown) performed on paraffin embedded spinal cord cross-sections on day 10 p.i. (n = 8 rats/experimental group) and 14 p.i. (n = 5 rats/experimental group). On day 10 p.i. CCR2+ cells were clearly detectable in the lesions of the PBS rats (B), while they were not present in the imatinib group (A). On day 14 p.i., in contrast to the imatinib-treated, spinal cord tissue from the PBS group undergoing EAE harbored high amounts of CCR2+ cells located in the blood vessels and perivascularly. Scale bar, 150 µm (A–D). (E, F) IF performed on spinal cord tissue cross-sections of the rats injected with fluorescent tracer (dextran, red) on day 14 p.i. (n = 5 rats/experimental group; representative images shown). Visualization of CCR2 antibody staining (in green), nuclei visualization by DAPI (blue). CCR2+ cells here shown in the subpial region exhibiting dextran extravasation and pronounced cell infiltration in the PBS group vs. imatinib-treated spinal cord region with moderate cell infiltration lacking in CCR2+ cells (E). (G) IF analysis quantification in correlation with dextran extravasation. CNS of the imatinib-treated rats significantly downregulated CCR2 expression comparing to controls on day 14 p.i. Scale bar, 50 µm (E, F). Imatinib or PBS oral gavage was performed from day 5 p.i until the end of the experiment. Error bars, S.E.M. Statistics were calculated using the t-test and P values <0.05 were considered significant (P<0.05 = *, P<0.01 = **, P<0.001 = ***).
Figure 5
Figure 5. Imatinib inhibits migration of T-cells into the CNS by downregulating chemokine expression in endothelial cells and not by altering recruitment of naïve T-cells into draining lymph nodes.
(A) Gene expression profiling in inguinal lymph nodes day 2 p.i. by qPCR. Neither mRNA transcript levels of CD34 and Glycam-1, adhesion markers expressed at the HEV nor CCR7 and L-selectin, homing markers on naïve T-cells were differentially expressed in imatinib vs. control treated mice (n = 4 mice/experimental group, both inguinal lymph nodes/animal). Imatinib or PBS oral gavage was performed from the immunization day until the end of the experiment (day 2 p.i.). (B) Endothelial vessel fragments (EVF) were biochemically isolated from the spinal cord of imatinib or PBS treated mice day 13 p.i. Gene expression profiling by qPCR revealed that P-selectin, CCL2, CCL19 and CXCL2 but not VCAM-1 and ICAM-1 were downregulated in imatinib-treated mice (n = 5 mice/experimental group). Imatinib or PBS oral gavage was performed from day 2 p.i. until day 13 p.i. (C–D). Evaluation of different T-cell subsets in spinal cords from imatinib-treated and control rats revealed less overall infiltration of both CD3+/CD8+ as well as CD3+/CD8 cells in response to imatinib. The relative proportion of CD3+/CD8+ and CD3+/CD8 cells was equal between the treatments. Scale bar, 50 µm. Imatinib or PBS oral gavage was performed from day 5 p.i until the end of the experiment. Error bars, S.E.M., Statistics were calculated using t-test and P values <0.05 were considered significant (P<0.05 = *, P<0.01 = **, P<0.001 = ***).
Figure 6
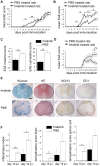
Figure 6. Therapeutic effect of imatinib in EAE.
Imatinib-treated rats developed less severe EAE compared to PBS controls. Female rats (n = 15 in each group) treated either with imatinib or PBS from day 5 p.i. until day 10 p.i. (A), or until the end of the experiment (B), respectively. (C) Imatinib-treated rats exhibited lower maximal and cumulative EAE score compared to the control rats (data from the experiment shown in B). (D) Female rats (n = 5 in each group) treated with either imatinib or PBS starting one day after the clinical manifestation of the disease (EAE score 1) until the end of the experiment. Imatinib treatment significantly ameliorated the disease in contrast to the control group. (E) Group representative paraffin embedded spinal cord cross-sections from imatinib and PBS treated rats on day 10 p.i. stained with Kluever (column 1), Hematoxylin-eosin (HE; column 2), W3/13 (column 3), and ED1 (column 4), respectively. Images from the staining performed on day 14 p.i. here not shown. On 10 days p.i. imatinib-treated rats had no signs of CNS inflammation and demyelination, whereas control rats exhibited severe loss of myelin and cell infiltration in the spinal cord white matter lesions, accompanied by recruitment of ED1+ macrophages and W3/13+ T-cells. Scale bar, 800 µm (F). Graphical representation of the inflammation parameters calculated as inflammatory index (I.I.) and demyelination score (DM) for both brain and spinal cord, respectively, on day 10 (n = 8 rats in each group) and day 14 p.i. (n = 5 rats in each group). Error bars represent S.E.M., statistics were calculated using the t-test and P values <0.05 were considered significant (P<0.05 = *, P<0.005 = **, P<0.0005 = ***).

References

    1. Persidsky Y, Ramirez SH, Haorah J, Kanmogne GD (2006) Blood-brain barrier: structural components and function under physiologic and pathologic conditions. J Neuroimmune Pharmacol 1: 223–236. - PubMed
    1. Ransohoff RM, Brown MA (2012) Innate immunity in the central nervous system. J Clin Invest 122: 1164–1171. - PMC - PubMed
    1. Holman DW, Klein RS, Ransohoff RM (2011) The blood-brain barrier, chemokines and multiple sclerosis. Biochim Biophys Acta 1812: 220–230. - PMC - PubMed
    1. Ransohoff RM, Engelhardt B (2012) The anatomical and cellular basis of immune surveillance in the central nervous system. Nat Rev Immunol 12: 623–635. - PubMed
    1. Sospedra M, Martin R (2005) Immunology of multiple sclerosis. Annu Rev Immunol 23: 683–747. - PubMed

Publication types

MeSH terms