. 2013;8(2):e56629.
doi: 10.1371/journal.pone.0056629. Epub 2013 Feb 21.

Selective sweep in the Flotillin-2 region of European Drosophila melanogaster

Affiliations

Selective sweep in the Flotillin-2 region of European Drosophila melanogaster

Annegret Werzner et al. PLoS One. 2013.

Abstract

Localizing genes that are subject to recent positive selection is a major goal of evolutionary biology. In the model organism Drosophila melanogaster many attempts have been made in recent years to identify such genes by conducting so-called genome scans of selection. These analyses consisted in typing a large number of genetic markers along the genomes of a sample of individuals and then identifying those loci that harbor patterns of genetic variation, which are compatible with the ones generated by a selective sweep. In this study we conduct an in-depth analysis of a genomic region located on the X chromosome of D. melanogaster that was identified as a potential target of recent positive selection by a previous genome scan of selection. To this end we re-sequenced 20 kilobases around the Flotillin-2 gene (Flo-2) and conducted a detailed analysis of the allele frequencies and linkage disequilibria observed in this new dataset. The results of this analysis reveal eight genetic novelties that are specific to temperate populations of D. melanogaster and that may have arisen during the expansion of the species outside its ancestral sub-Saharan habitat since about 16,000 years ago.


Conflict of interest statement

Competing Interests: The authors have declared that no competing interests exist.

Figures

Figure 1
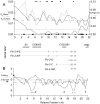
Figure 1. Nucleotide variation of the Flo-2 region in an African and European sample of D. melanogaster.
A) The valley of reduced genetic variation in a European sample of D. melanogaster compared to an ancestral population sample from Africa (solid lines; first y-axis, θW). The fully sequenced 20,011-bp fragment of the Flo-2 region is connected with an adjacent fragment of Ometto et al. , indicated by squares at coordinate 0 (white square-Africa; black square-Europe, distance to the fully sequenced Flo-2 region around 3,000 bp, θW values were interpolated between the two fragments). The x-axis shows the relative position on the X-chromosome. The dashed horizontal lines show the average nucleotide variation of the X-chromosome for the African population sample (wide dashed line, θAX = 0.0131) and the European population sample (dashed line, θEX = 0.0047). Black triangles show the position of indels; black diamonds indicate fixed nucleotide differences between both samples. The second y-axis corresponds to divergence of D. melanogaster to D. sechellia (dashed line). The gene map gives the name and the position of the coding sequence of all genes located within the valley of reduced variation. These genes are Eo, CG9503 CG32591, pdgy (partly) and eight different transcripts of Flo-2. B) Tajima’s D statistic (solid lines) is shown for the African and European sample of D. melanogaster (white square-Africa; black square-Europe). The horizontal lines show the average value of Tajima’s D for the X chromosome of the African population sample (wide dashed line, D XA = −0.608) and the European population sample (dashed line, D XE = −0.103). Significance values are indicated as follows: # P<0.10; *P<0.05; **P<0.01.
Figure 2
Figure 2. The sweep analysis reveals two profiles: the solid line shows the CLR of SweepFinder, the dashed line shows the result of the ω statistic.
The horizontal lines give the 5% significance threshold for the CLR test (solid line, THCLR = 32.3) and the ω statistic (dashed line, THω = 65.2).

References

    1. Maynard Smith J, Haigh J (1974) The hitch-hiking effect of a favourable gene. Genet Res 23: 23–35. - PubMed
    1. Kaplan NL, Hudson RR, Langley CH (1989) The “hitchhiking effect” revisited. Genetics 123: 887–899. - PMC - PubMed
    1. Stephan W, Wiehe THE, Lenz MW (1992) The effect of strongly selected substitutions on neutral polymorphism: Analytical results based on diffusion theory. Theoretical Population Biology 41: 237–254.
    1. Braverman JM, Hudson RR, Kaplan NL, Langley CH, Stephan W (1995) The hitchhiking effect on the site frequency spectrum of DNA polymorphisms. Genetics 140: 783–796. - PMC - PubMed
    1. Fay JC, Wu CI (2000) Hitchhiking under positive Darwinian selection. Genetics 155: 1405–1413. - PMC - PubMed

Publication types

LinkOut - more resources