

Review
doi: 10.1021/cr3003533.
Epub 2013 Feb 26.
Protein analysis by shotgun/bottom-up proteomics
Affiliations
- PMID: 23438204
- PMCID: PMC3751594
- DOI: 10.1021/cr3003533
Item in Clipboard
Review
Protein analysis by shotgun/bottom-up proteomics
Chem Rev.
.
No abstract available
Figures
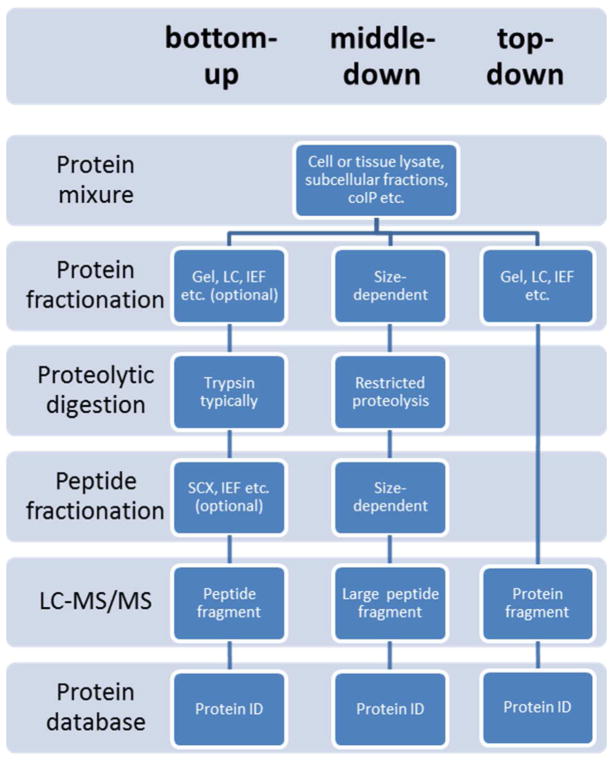
Proteomic strategies: bottom-up vs. top-down vs. middle-down. The bottom-up approach analyzes proteolytic peptides. The top-down method measures the intact proteins. The middle-down strategy analyzes larger peptides resulted from limited digestion or more selective proteases. One or more protein or peptide fractionation techniques can be applied prior to MS analysis and database searching.
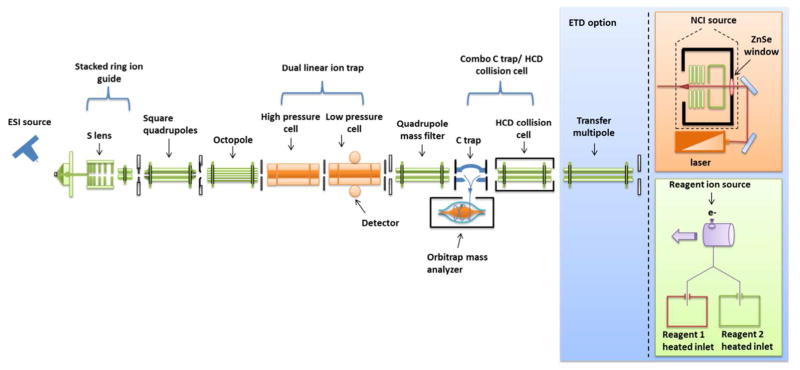
Diagrammatic summary of LIT- and Orbitrap-based mass spectrometers for proteomics. All but the IR fragmentation (orange box) is commercially available either as a single mass spectrometer or a combination of some essential components. Peptides are electrosprayed direclty from a LC separation into the heated inlet source where desolvated peptide ions are focused by a stacked ring ion guide (S-lens), then focused, filtered (typically 300–2000 m/z), and transferred by the square quadrupole and octapole to the dual LIT. Peptide ions are collected, isolated, and fragmented by CID in the high pressure cell. Isolated precursor and fragment ions are passed to the low pressure trap for detection. This sequence of events is currently considered a state-of-the-art LIT experiment primarily for protein identification and label-free protein quantification. For higher resolution and mass accuracy detection, precursor or fragment ions can be passed to the Orbitrap mass analyzer via the second quadrupole and C-trap. Beam-type collision can be performed in the HCD collision cell instead of the ion trap for detection with Orbitrap. The Orbitrap detects ion currents of peptide ions that process around an orbital electrode. A Fourier transform is used to convert the frequency-based ion current to a m/z value. Either of these fragmentation schemes with Orbitrap detection are considered state-of-the-art for high mass accuracy peptide analysis and are most often used for protein and post-translational modification identification and quantification with isotopic labeling. Alternative fragmentation methods of ETD, IRMPD, or the combination IR-ETD can be used in conjunction with either the LIT or Orbitrap mass analyzers. The simplest configuration most recently demonstrated is a Q-Orbitrap with HCD detection which consists of only the S-lens, quadrupole mass filter, C-trap, Orbitrap, and HCD collision cell. This configuration and experiment design is quite similar to the QToF illustrated in Figure 3.
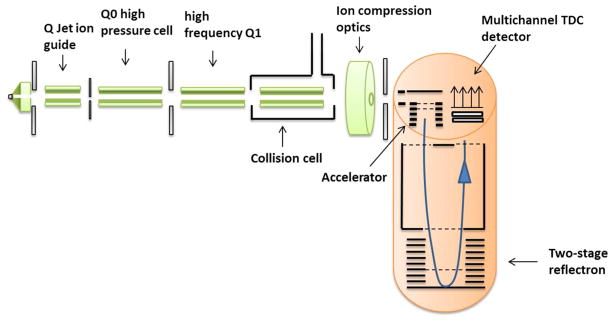
Schematic diagram of a QToF. The QToF allows for consecutive precursor mass filtering and fragmentation, an essential for shotgun proteomics which measures both intact and fragment ion masses of peptides. Essentially the instrument is a high mass accuracy QQQ frequently used in proteomics for targeted protein quantification experiments. Peptide ions from electrospray ionization are continuously focused by a Q jet ion guide, accelerated through quadrupole zero (Q0), Q1, and the collision cell for precursor peptide mass detection by time-of-flight and multichannel time-to-digital conversion (TDC) detector. Subsequently, abundant precursor ions can be selected by Q1 and fragmented in the collision cell prior to orthogonal acceleration for ToF detection.
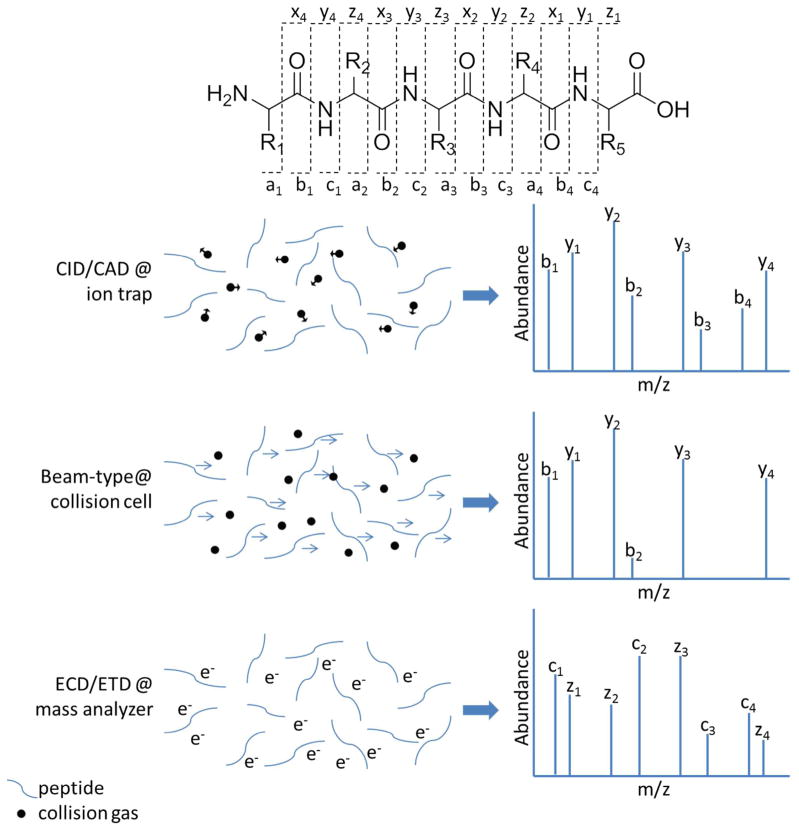
Common peptide fragmentation methods. Peptides are cleaved along the peptide backbone to sequence the peptide. CID/CAD entails acceleration of the kinetic energy of ions to promote energetic collisions with a target gas, thus causing conversion of the ion’s kinetic energy to internal energy and ultimately resulting in ion fragmentation. Most fragmentation pathways rely on proton transfer. For trapping instruments that employ resonant excitation, the waveform used to accelerate a precursor ion is specific for a particular m/z value, thus only the selected precursor ion is activated. The resulting fragment ions are not excited and thus do not dissociate further, allowing detection of an array of predominantly both b and y ions (as well as others). In contrast to resonant excitation in trapping instruments, in beam-type CID both the selected precursor ions and any resulting fragment ions are passed through a collision region which enables further activation and dissociation of the fragment ions. This means that the less stable b ions will frequently decompose to very small ions. Thus, both peptide precursors and their fragment ions are activated and mostly y-type fragment ions persist. Unlike CID, ECD and ETD fragmentation relies on the gas phase reaction of the peptide ions with a thermal electron or an ETD reagent, respectively. The electron transfer-driven fragmentation mechanisms create mostly c- and z-type ions.
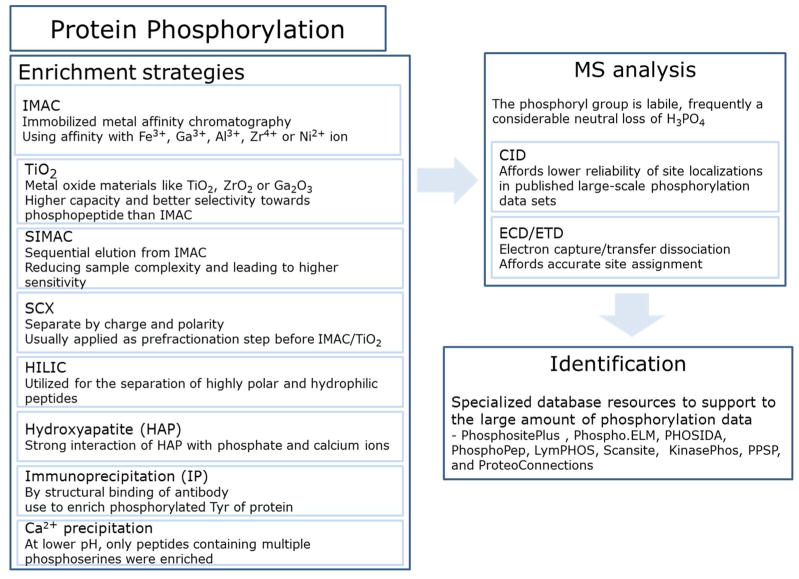
Overview of phosphoproteomic methods
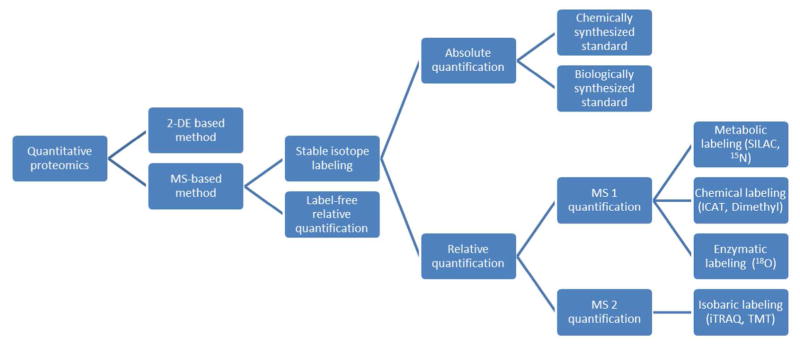
Categorization of the main strategies for quantitative proteomics.
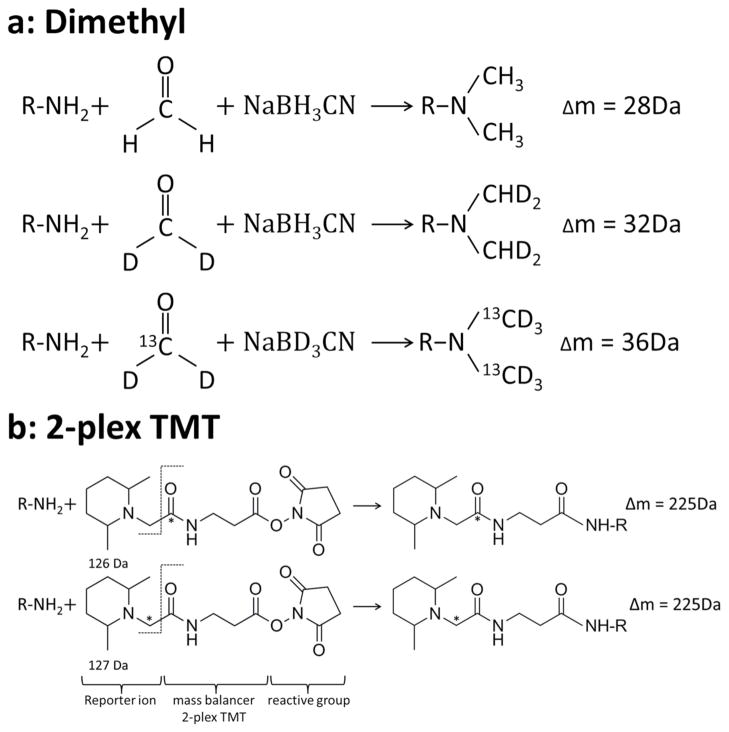
Labeling reactions of triplex stable isotope dimethyl labels and duplex TMT labels. Both labeling methods target the N-terminus and Lys of peptides with a reactive isotopic group. a: Dimethyl labeling introduces different mass increases via different isotopic reagents. b: TMT labeling introduces equal mass increases via different reagents. The reporter ions with different masses are released during peptide fragmentation. Asterisk indicates a 13C atom replacement.
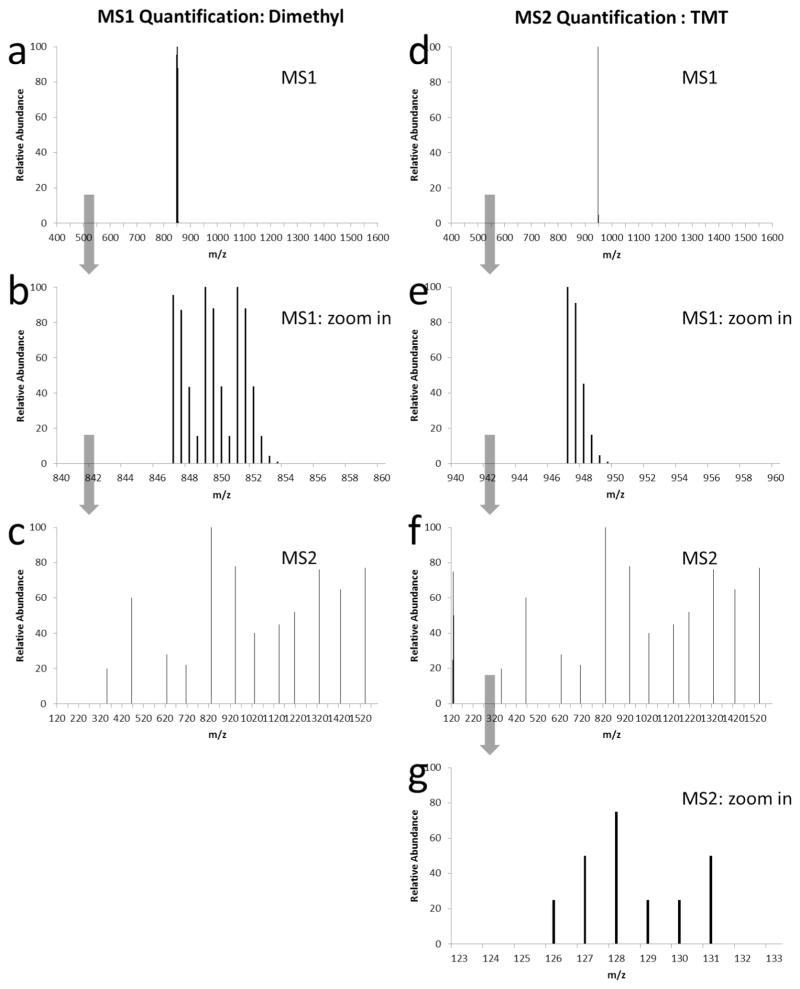
Two quantitative strategies based on chemical reaction. The representative peptide is doubly charged, and consisting of 15 molecules of averagine, a hypothetical amino acid. Averagine has a molecular formula of C4.9384 H7.7583 N1.3577 O1.4773 S0.0417, which is derived from statistical occurrence of amino acids in the protein identification resource protein database. a, b, c: Dimethyl labeling. The quantification is calculated based on the ion intensities in MS1. The MS2 is only used to identify the peptide sequence (c). This given peptide has slight isotopic peak overlap between the three groups (b), the overlapped areas will become more significant for longer peptides. d, e, f, g: 6-plex TMT labeling. The quantification is calculated based on the report ion intensities in MS2 (g). The MS2 is used for both peptide sequence identification (f) and quantification (g). The mixed peptide groups have the same m/z in MS1 (e).
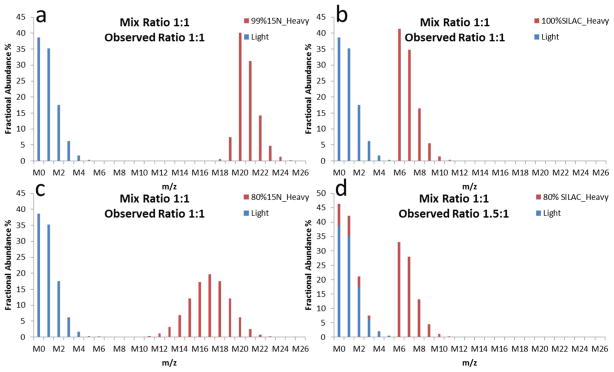
Comparison of 15N and SILAC quantifications. The peptide presented here consists of 15 molecules of hypothetical amino acid, averagine. Averagine has a molecular formula of C4.9384 H7.7583 N1.3577 O1.4773 S0.0417, which is derived from statistical occurrence of amino acids in the protein identification resource protein database. Each spectrum represents a 1:1 mixture of unlabeled and labeled peptides. (a), (b): The mass spectra observed when the labeling efficiency is or nearly complete for 15N and SILAC quantifications. 15N labeling typically generates bigger mass increase compared to SILAC labeling. (c), (d): The mass spectra observed when the labeling efficiency is 80% for 15N and SILAC quantifications. 15N is still able to result in an accurate quantitative ratio, whereby the SILAC labeling leads to a false ratio. SILAC quantitative labeling is not compatible with partial labeling because the observed unlabeled peaks do not exclusively originate from unlabeled sample.
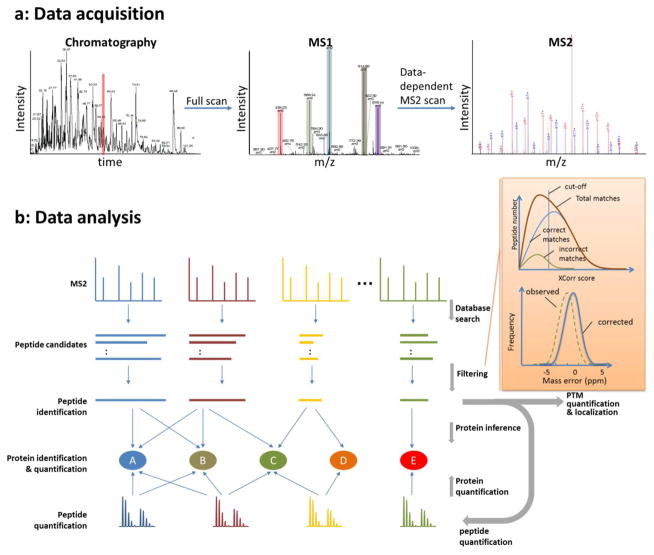
Representative LC-MS/MS data and a generalized bioinformatic analysis pipeline for protein identification and quantification in shotgun proteomics. (a) As a total ion chromatogram is acquired by nESI-MS from the nLC separation of peptides, the mass spectrometer acquires both full scan MS (MS1) precursor spectra and data-dependent MS/MS (MS2) fragmentation spectra. All ions, typically between 300 – 2000 m/z, are detected during nLC in the full MS scans. The full scan defines the most abundant peptide precursor ions which are sampled by data-dependent for MS/MS. (b) The acquired data is then processed through a bioinformatics pipeline. A database search is used to match theoretically generated peptide fragmentation spectra to experimental MS2 fragmentation spectra, creating a list of peptide candidates for each experimental spectrum. The peptide candidates are ranked and filtered to create peptide spectrum matches (PSMs) and peptide identifications. PSMs can be filtered by XCorr using the “incorrect” reverse PSMs as an estimation of false discovery rate (FDR). In high mass accuracy experiments, prior to XCorr filtering a mass error window can be used to prefilter PSMs based on the precursor mass measurement from MS1 scans. If a systematic mass error is “observed”, it can be “corrected” by adding or subtracting the average mass error. Identified peptides are assigned to proteins by inference to create a list of proteins present within the sample. The relative protein quantification is then performed by averaging the peptide ratio measurements for peptides assigned to the protein. These same strategies can be used for post-translational modification (PTM) identification and quantification, by using a peptide as a surrogate measurement of the PTM.
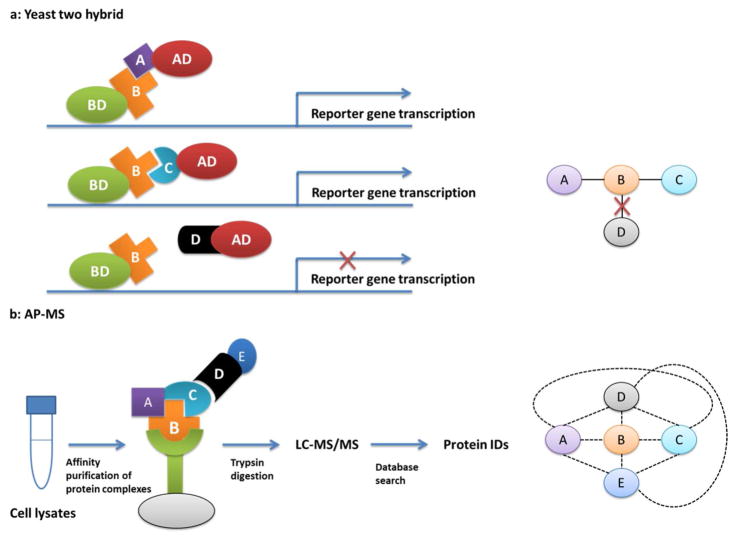
The protein-protein interaction detected by Y2H and AP-MS. a: Y2H is used to detect binary interaction. The results here demonstrate the protein B can interact with protein A and C, but not D. b: AP-MS is used to identify the whole protein complex. All the interactors binding to protein B, including both direct and indirect binders, are identified by shotgun proteomics.
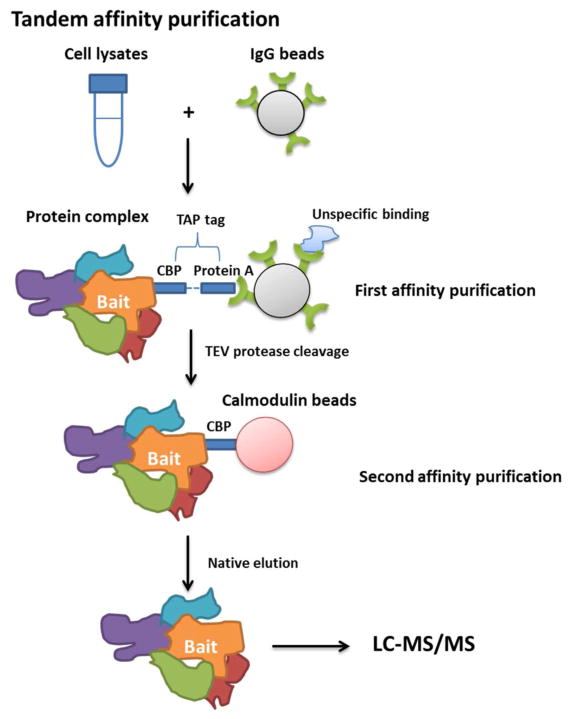
Scheme of tandem affinity purification (TAP). Two steps of purification significantly remove the unspecific binding proteins.
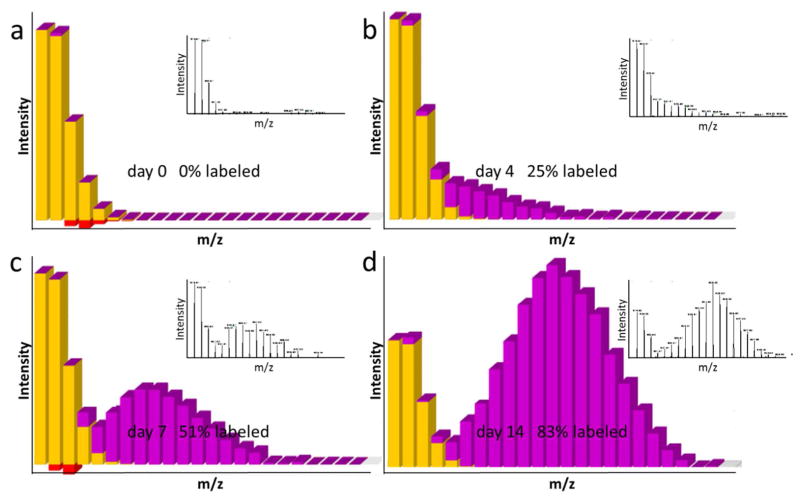
The protein turnover measured by 15N partial labeling with the software ProTurnyzer. The representative peptide has an amino acid sequence of LDKSQIHDIVLVGGSTR derived from mouse heat shock cognate 71 kDa protein. The yellow peaks represent the pre-existing peptide with natural isotopic composition, whereby the purple peaks represent peptide synthesized during 15N feeding. The gain of purple and removal of yellow reflect protein synthesis and protein degradation, respectively. The red bars indicate the intensity error between theoretical and measured peptide isotope distributions. The inset figures are the observed mass spectra for which the unlabeled and labeled peptide peaks were analyzed.
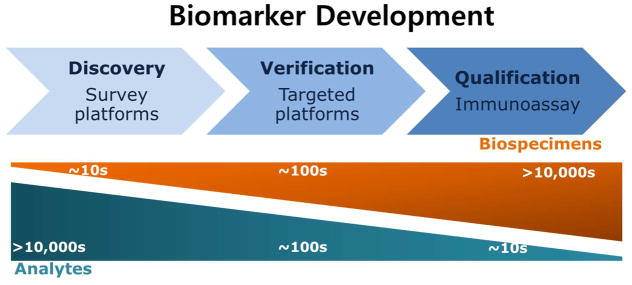
Steps of biomarker development
References
-
- Lander ES, Linton LM, Birren B, Nusbaum C, Zody MC, Baldwin J, Devon K, Dewar K, Doyle M, FitzHugh W, Funke R, Gage D, Harris K, Heaford A, Howland J, Kann L, Lehoczky J, LeVine R, McEwan P, McKernan K, Meldrim J, Mesirov JP, Miranda C, Morris W, Naylor J, Raymond C, Rosetti M, Santos R, Sheridan A, Sougnez C, Stange-Thomann N, Stojanovic N, Subramanian A, Wyman D, Rogers J, Sulston J, Ainscough R, Beck S, Bentley D, Burton J, Clee C, Carter N, Coulson A, Deadman R, Deloukas P, Dunham A, Dunham I, Durbin R, French L, Grafham D, Gregory S, Hubbard T, Humphray S, Hunt A, Jones M, Lloyd C, McMurray A, Matthews L, Mercer S, Milne S, Mullikin JC, Mungall A, Plumb R, Ross M, Shownkeen R, Sims S, Waterston RH, Wilson RK, Hillier LW, McPherson JD, Marra MA, Mardis ER, Fulton LA, Chinwalla AT, Pepin KH, Gish WR, Chissoe SL, Wendl MC, Delehaunty KD, Miner TL, Delehaunty A, Kramer JB, Cook LL, Fulton RS, Johnson DL, Minx PJ, Clifton SW, Hawkins T, Branscomb E, Predki P, Richardson P, Wenning S, Slezak T, Doggett N, Cheng JF, Olsen A, Lucas S, Elkin C, Uberbacher E, Frazier M. Nature. 2001;409:860. - PubMed
-
- Venter JC, Adams MD, Myers EW, Li PW, Mural RJ, Sutton GG, Smith HO, Yandell M, Evans CA, Holt RA, Gocayne JD, Amanatides P, Ballew RM, Huson DH, Wortman JR, Zhang Q, Kodira CD, Zheng XH, Chen L, Skupski M, Subramanian G, Thomas PD, Zhang J, Gabor Miklos GL, Nelson C, Broder S, Clark AG, Nadeau J, McKusick VA, Zinder N, Levine AJ, Roberts RJ, Simon M, Slayman C, Hunkapiller M, Bolanos R, Delcher A, Dew I, Fasulo D, Flanigan M, Florea L, Halpern A, Hannenhalli S, Kravitz S, Levy S, Mobarry C, Reinert K, Remington K, Abu-Threideh J, Beasley E, Biddick K, Bonazzi V, Brandon R, Cargill M, Chandramouliswaran I, Charlab R, Chaturvedi K, Deng Z, Di Francesco V, Dunn P, Eilbeck K, Evangelista C, Gabrielian AE, Gan W, Ge W, Gong F, Gu Z, Guan P, Heiman TJ, Higgins ME, Ji RR, Ke Z, Ketchum KA, Lai Z, Lei Y, Li Z, Li J, Liang Y, Lin X, Lu F, Merkulov GV, Milshina N, Moore HM, Naik AK, Narayan VA, Neelam B, Nusskern D, Rusch DB, Salzberg S, Shao W, Shue B, Sun J, Wang Z, Wang A, Wang X, Wang J, Wei M, Wides R, Xiao C, Yan C. Science. 2001;291:1304. - PubMed
-
- Wilkins MR, Pasquali C, Appel RD, Ou K, Golaz O, Sanchez JC, Yan JX, Gooley AA, Hughes G, Humphery-Smith I, Williams KL, Hochstrasser DF. Biotechnology (N Y) 1996;14:61. - PubMed
-
- James P. Q Rev Biophys. 1997;30:279. - PubMed
-
- Gstaiger M, Aebersold R. Nat Rev Genet. 2009;10:617. - PubMed
Publication types
MeSH terms
Substances
Grants and funding
LinkOut - more resources
Full Text Sources
Other Literature Sources
