. 2013 Feb 20;77(4):723-35.
doi: 10.1016/j.neuron.2012.12.039.

A cholinergic mechanism for reward timing within primary visual cortex

Affiliations

A cholinergic mechanism for reward timing within primary visual cortex

Alexander A Chubykin et al. Neuron. .

Abstract

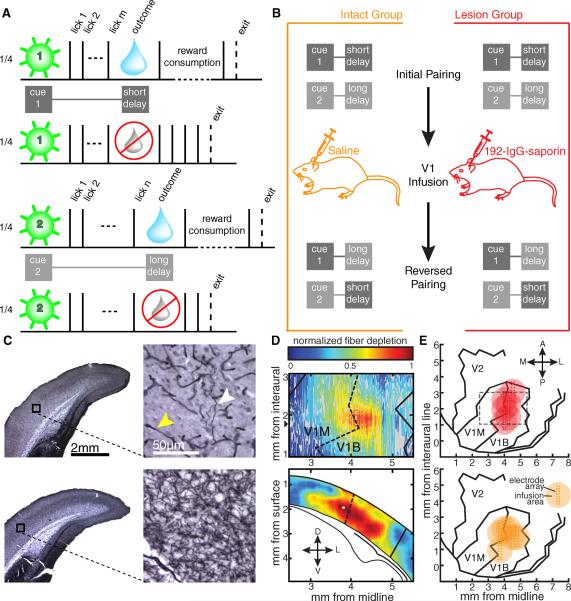
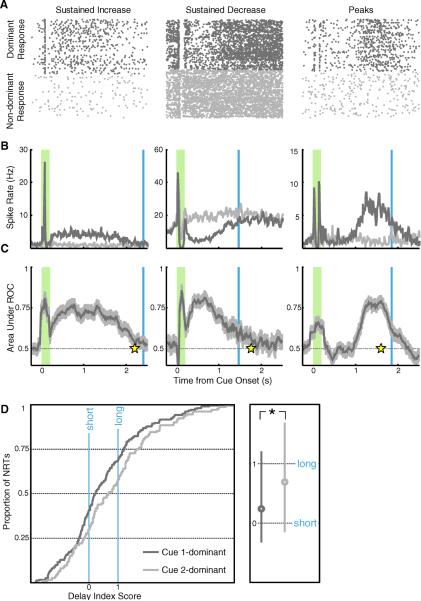
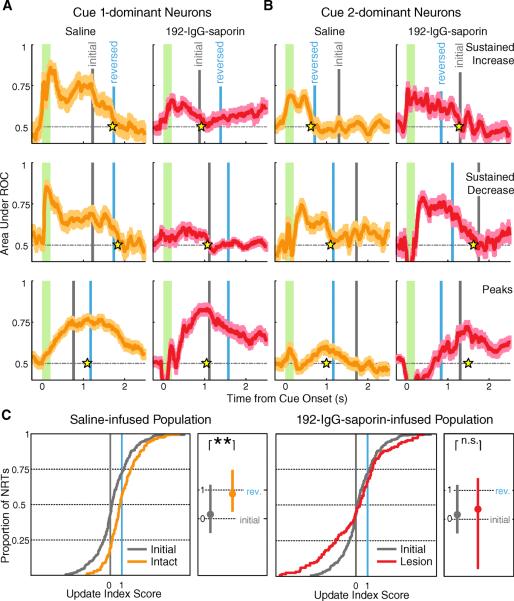
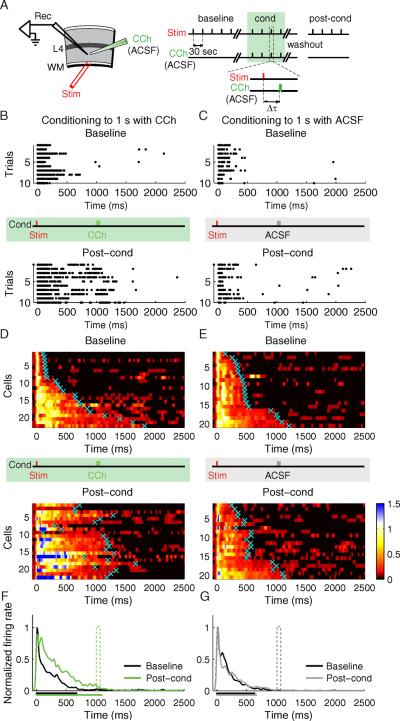
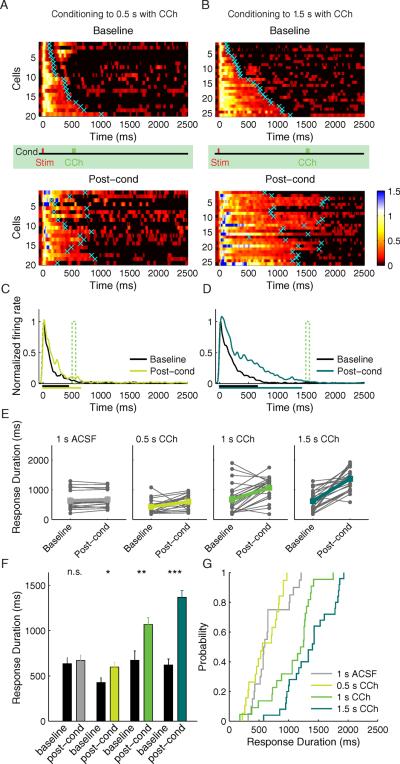
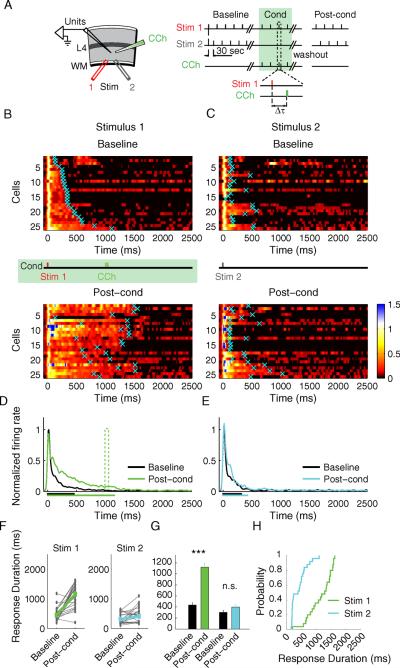
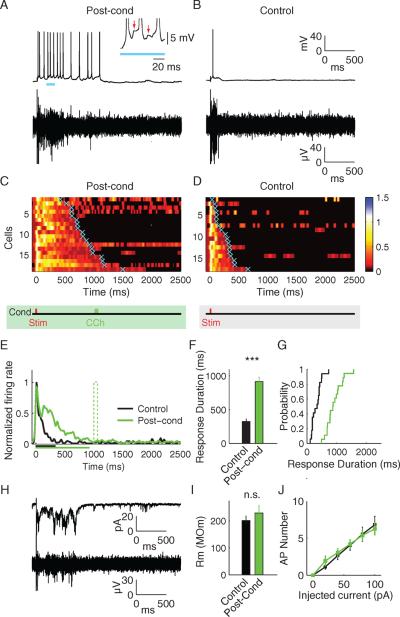
Neurons in rodent primary visual cortex (V1) relate operantly conditioned stimulus-reward intervals with modulated patterns of spiking output, but little is known about the locus or mechanism of this plasticity. Here we show that cholinergic basal forebrain projections to V1 are necessary for the neural acquisition, but not the expression, of reward timing in the visual cortex of awake, behaving animals. We then mimic reward timing in vitro by pairing white matter stimulation with muscarinic receptor activation at a fixed interval and show that this protocol results in the prolongation of electrically evoked spike train durations out to the conditioned interval. Together, these data suggest that V1 possesses the circuitry and plasticity to support reward time prediction learning and the cholinergic system serves as an important reinforcement signal which, in vivo, conveys to the cortex the outcome of behavior.


Figures

Fig 1
Fig 1
Experimental design. A) Following a 2 s intertrial interval, rats could enter the nosepoke to activate one of four pseudorandomly interleaved trial types. A brief cue (green flash) was presented to either the left eye or the right and was predictive of the number of licks (solid black ticks) required to gain a small bolus of water (blue drop) in half of the trials. B) Implanted animals performed the task as outlined in A before receiving a bilateral infusion of either saline or 192-IgG-saporin into V1. Following recovery, the task parameters were reversed such that the cue previously associated with the short delay was now paired with the longer delay and vice versa. C) Coronal sections demonstrating AChE histochemistry from a lesioned animal (top) and an intact animal (bottom). The black boxes on the low magnification images (left) correspond to the high magnification regions on the right. The white arrowhead indicates a remaining fiber stained for AChE, and the yellow arrowhead indicates a capillary. D) Example visualization of fiber depletion. The contour plot (top) shows the relative difference of laminar-averaged staining intensity between atlas-matched sections from an intact and lesioned hemisphere. The heat plot (bottom) represents the relative comparison for the coronal slice with the widest apparent lesion extent (anterior-posterior position indicated by the black triangle next to the contour plot above). The solid lines demarcate the boundary of V1 while the dashed lines indicate the border between the monocular (V1M) and binocular (V1B) portions of V1. Lower diagram adapted from Paxinos and Watson (2008). E) Aerial view of approximate recording locations and infusion zones for the lesion (top) and intact (bottom) groups. Each large circle indicates the expected region affected by the infusion for each animal, and the estimated position of the 8×2 recording electrode array is indicated by the pin points. The gray dashed line indicates the region shown in the contour plot in D. Aerial maps adapted from Zilles (Zilles, 1985).
Fig 2
Fig 2
V1 neurons recorded under initial pairing. A–C) Columns contain single unit examples of each form of reward timing (left: sustained increase, center: sustained decrease, right: peaks). A) Dots represent spikes recorded from a single unit in a behavioral session, with responses to the dominant cue on top (dark gray) and non-dominant below (light gray). The raster plots are gathered from all correctly completed unrewarded trials, aligned at stimulus onset, and stacked in chronological order. B) Smoothed, average spike rates compiled across trials are shown in dark gray for the dominant response and light gray for the non-dominant (shaded green bar: cue presentation; blue line: average reward delivery following the dominant cue). C) Bin-bybin ROC analysis, comparing responses evoked in all trials of dominant and non-dominant cue presentation, provides the area under each ROC curve (dark gray) and a 95% confidence interval (light gray). For sustained increase (left) and sustained decrease neurons (center), the neural report of time (response time; yellow star) is defined as the first bin returning to chance. For peak neurons (right), the neural report of time is defined as the maximal ROC value. D) Cumulative population distributions of delay index scores are plotted on the left, where zero represents the short delay to reward and one represents the long delay. Plotted in dark gray is the population of neurons (n = 180) whose response is dominated by the cue associated with the short delay (cue 1) and in light gray the population (n = 116) dominated by the cue paired with the longer delay (cue 2). The median values of these distributions lie close to zero and one respectively, and are significantly different from one another (Mann-Whitney U test P < 0.05), indicating that the observed subpopulations accurately relate the reward times associated with their dominant cues. The boxplot on the right indicates the median values (circle) and 25–75% percentile range (line) for each subpopulation.
Fig 3
Fig 3
V1 neurons recorded following cortical infusion and cue-reward reversal. A–B) Example neurons exhibiting sustained increase (top), sustained decrease (middle) and peak (bottom) reward timing recorded from intact (orange) and lesioned (red) animals following V1 drug infusion and cue-reward pairing reversal. Conventions are as in Fig. 2, with the current reward time associated with the dominant cue shown in blue (“reversed”) and the reward time initially associated with the dominant cue shown in gray (“initial”). A) Cue 1-dominant neurons from saline-infused animals (left) update their policy to reflect the reversed contingency (cue 1 associated with a long delay) while neurons from lesioned animals (right) continue to report the initial policy. B) Cue 2-dominant neurons report the new contingency (cue 2 associated with a short delay) in intact animals (left), while neurons from 192-IgG-saporin-infused animals (right) continue to express the outdated policy. C) NRTs recorded following contingency reversal, plotted as cumulative population distributions of update index scores. Zero represents the reward time initially associated with the dominant cue and one represents the reward time associated with the dominant cue following reversal (gray: observations recorded under the initial task parameters; orange: observations collected from intact animals after reversal; red: observations gathered from lesioned animals after reversal). Scores from intact animals (left; n = 182) form a population with a median value that is distinct from the initial observations (Mann-Whitney U test P < 10−10) while neurons collected from lesioned animals (right; n = 131) continue as a population to report the same median value (P = 0.6929). See also Figure S1 and S2. Boxplot conventions are as in Fig 2.
Fig. 4
Fig. 4
Response Duration Plasticity. A) Experimental design (Rec, recording electrode; Stim, stimulating electrode; WM, white matter; L4, layer 4; CCh, carbachol; ACSF, artificial cerebrospinal fluid). Conditioning (cond) is performed by CCh application at Δt delay after electrical stimulation. B–C) Raster plots of representative neurons before (baseline) and after (post-cond) conditioning. B) A neuron conditioned with CCh applied at 1s delay. C) A control neuron conditioned with ACSF applied at 1s delay. The vertical red tick indicates the time of electrical stimulus, the vertical green and gray ticks indicate the time corresponding to the CCh- or ACSF- application during conditioning, correspondingly. D–E) SDFs of the neurons before (baseline) and after (post-cond) CCh conditioning (D; n = 22 neurons from 8 animals), or, ACSF conditioning (E; n = 20 from 6 animals). For visualization, the color scale shows spike densities greater than 1 standard deviation above spontaneous, normalized to the peak response magnitude during the baseline period. Cyan crosses represent neurons' calculated response durations (time to return to 1 STD of a neuron's spontaneous firing rate). Individual neuronal responses are sorted according to the baseline response durations. F) Population SDFs before (black) and after (green) CCh conditioning. G) Population SDFs before (black) and after (gray) control ACSF conditioning. The mean neuronal response duration before and after conditioning is shown as the corresponding colored bars below the x axis. See also Figure S3.
Fig. 5
Fig. 5
Conditioning to two different stimulus-CCh delays, 0.5 s and 1.5 s. A) SDFs before and after conditioning to 0.5 s stimulus-reward interval; n = 19 from 7 animals. Conventions are the same as Fig. 4. B) Plots of SDFs before and after conditioning to 1.5 s stimulus-reward interval; n = 25 from 10 animals. Individual neuronal responses are sorted according to the initial response time. C) Population SDFs conditioned to the 0.5 s stimulus-reward interval before (black) and after (light green) conditioning. D) Population SDFs conditioned to the 1.5 s stimulus-reward interval before (black) and after (dark green) conditioning. The mean neuronal response duration before and after conditioning is shown as the corresponding colored bars below the x axis. E) Connected filled circles represent response times of individual neurons before and after conditioning with ACSF (gray) and with CCh to different stimulus-reward times 0.5 s (light green), 1.0 s (green), 1.5 s (dark green). Post-cond, post-conditioning. F) Mean response times of the neurons before (black) and after (colored) conditioning. Error bars represent S.E.M. * P < 0.05; **P < 0.01; ***P < 0.001, Student's t-test. G) Cumulative probability distributions of the neuronal response times after conditioning with ACSF and CCh. See also Figure S4 & S5.
Fig. 6
Fig. 6
Two-pathway experiment. A) Experimental setup. Stim 1 represents the conditioned stimulus; Stim 2 represents the control stimulus. B) SDF's before (baseline) and after (post-cond) conditioning with a 1s stimulus-CCh interval, n = 25 units from 9 animals. Conventions are the same as Fig. 4. C) SDF's of the neurons in response to the control stimulus. Both B) and C) represent responses of the same neurons to Stim 1 and Stim 2; individual neuronal responses are sorted according to the initial duration of response to the Stim 1 electrode. D) Population SDF to the conditioned stimulus before (black) and after (green) conditioning. E) Population SDF to the control stimulus before (black) and after (cyan) conditioning. The mean neuronal response duration before and after conditioning is shown as the corresponding colored bars below the x axis. F) Individual response times of the conditioned (green) and the control (cyan) stimuli. G) Mean Response times of the conditioned and the control stimuli, ***P < 0.001; n.s., not significant; Student's t-test. H) Cumulative probability distributions of the neuronal responses after conditioning.
Fig. 7
Fig. 7
Characterization of response time plasticity using whole-cell patch clamp. A) Representative traces of the current clamp recordings (top) and the simultaneous multi-unit recordings (bottom) post-conditioning. The persistent firing is triggered by the barrages of synaptic potentials resulting in irregular spike frequency. The insert shows a part of the current-clamp recording with the arrows indicating excitatory postsynaptic potentials (EPSPs). B) Control traces. C&D) SDFs of the individual whole-cell recordings C) post-conditioning (n=18 from 10 animals, and D) from control whole-cell recordings (n=17 from 8 animals). Neuronal responses are sorted according to their duration. Cyan crosses represent the calculated response durations. E) Population SDFs of the conditioned (green) and the control neurons (black). The mean neuronal response duration for control and post-conditioning is shown as the corresponding colored bars below the x axis. F) Mean response durations of the control (black) and the conditioned (green) neurons. Error bars represent S.E.M. * - *** - P<0.001, Student's t-test. G) Cumulative probability distributions of the control and the conditioned neuronal response durations. H) Voltage clamp recording of the individual cell (top) and the simultaneous extracellular multi-unit recording (bottom). Barrages of synaptic currents correspond well with the extracellular recordings of spiking activity. I) Membrane resistance of the control (black) and the conditioned (green) neurons was not significantly different. J) Intrinsic excitability of the conditioned and control neurons was also not significantly different as measured by the number of action potentials (AP) triggered by the increasing step current injections. See also Figure S6 & S7.

References

    1. Bear MF, Singer W. Modulation of visual cortical plasticity by acetylcholine and noradrenaline. Nature. 1986;320:172–176. - PubMed
    1. Bekisz M, Garkun Y, Wabno J, Hess G, Wrobel A, Kossut M. Increased excitability of cortical neurons induced by associative learning: an ex vivo study. The European journal of neuroscience. 2010;32:1715–1725. - PubMed
    1. Breton J-D, Stuart GJ. Loss of sensory input increases the intrinsic excitability of layer 5 pyramidal neurons in rat barrel cortex. The Journal of physiology. 2009;587:5107–5119. - PMC - PubMed
    1. Brocher S, Artola A, Singer W. Agonists of cholinergic and noradrenergic receptors facilitate synergistically the induction of long-term potentiation in slices of rat visual cortex. Brain Res. 1992;573:27–36. - PubMed
    1. Budd JM. Extrastriate feedback to primary visual cortex in primates: a quantitative analysis of connectivity. Proceedings. Biological sciences / The Royal Society. 1998;265:1037–1044. - PMC - PubMed

Publication types

LinkOut - more resources