

Associations of food stamp participation with dietary quality and obesity in children
- PMID: 23439902
- PMCID: PMC3581840
- DOI: 10.1542/peds.2012-0889
Associations of food stamp participation with dietary quality and obesity in children
Abstract
Objective: To determine if obesity and dietary quality in low-income children differed by participation in the Supplemental Nutrition Assistance Program (SNAP), formerly the Food Stamp Program.
Methods: The study population included 5193 children aged 4 to 19 with household incomes ≤130% of the federal poverty level from the 1999-2008 NHANES. Diet was measured by using 24-hour recalls.
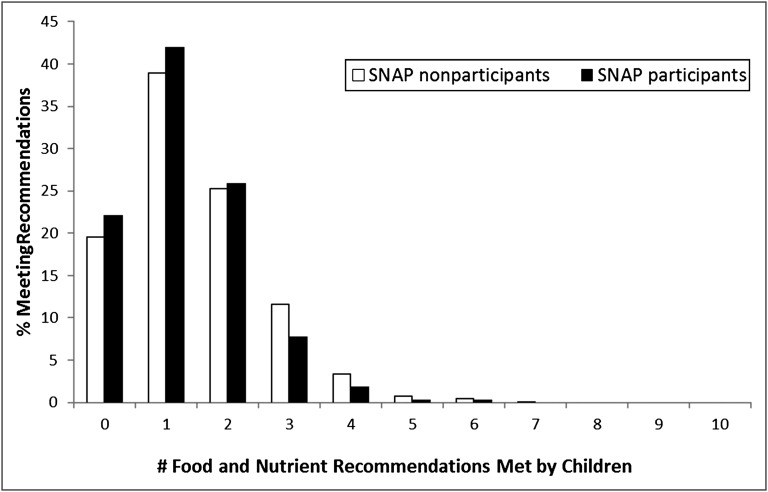
Results: Among low-income US children, 28% resided in households currently receiving SNAP benefits. After adjusting for sociodemographic differences, SNAP participation was not associated with a higher rate of childhood obesity (odds ratio = 1.11, 95% confidence interval [CI]: 0.71-1.74). Both SNAP participants and low-income nonparticipants were below national recommendations for whole grains, fruits, vegetables, fish, and potassium, while exceeding recommended limits for processed meat, sugar-sweetened beverages, saturated fat, and sodium. Zero percent of low-income children met at least 7 of 10 dietary recommendations. After multivariate adjustment, compared with nonparticipants, SNAP participants consumed 43% more sugar-sweetened beverages (95% CI: 8%-89%), 47% more high-fat dairy (95% CI: 7%, 101%), and 44% more processed meats (95% CI: 9%-91%), but 19% fewer nuts, seeds, and legumes (95% CI: -35% to 0%). In part due to these differences, intakes of calcium, iron, and folate were significantly higher among SNAP participants. Significant differences by SNAP participation were not evident in total energy, macronutrients, Healthy Eating Index 2005 scores, or Alternate Healthy Eating Index scores.
Conclusions: The diets of low-income children are far from meeting national dietary recommendations. Policy changes should be considered to restructure SNAP to improve children's health.
Figures
References
-
- From Food Stamps to the Supplemental Nutrition Assistance Program. Legislative timeline. Available at: www.fns.usda.gov/snap/rules/Legislation/timeline.pdf. Accessed July 23, 2012
-
- Monthly data SNAP. Available at: www.fns.usda.gov/pd/34SNAPmonthly.htm. 2012. Accessed March 9, 2012
-
- Current participation SNAP. Available at: www.fns.usda.gov/pd/30SNAPcurrHH.htm. Accessed March 9, 2012
-
- Eligibility. Supplemental Nutrition Assistance Program. www.fns.usda.gov/snap/applicant_recipients/eligibility.htm. 2011. Accessed October 13, 2011
-
- FY 2011 Income Eligibility Standards. Available at: www.fns.usda.gov/snap/government/FY11_Income_Standards.htm. 2011. Accessed October 12, 2011
Publication types
MeSH terms
Grants and funding
LinkOut - more resources
Full Text Sources
Other Literature Sources
Medical
Miscellaneous
