. 2013 Mar 11;210(3):623-39.
doi: 10.1084/jem.20121610. Epub 2013 Feb 25.

TGFβ restores hematopoietic homeostasis after myelosuppressive chemotherapy

Affiliations

TGFβ restores hematopoietic homeostasis after myelosuppressive chemotherapy

Fabienne Brenet et al. J Exp Med. .

Abstract

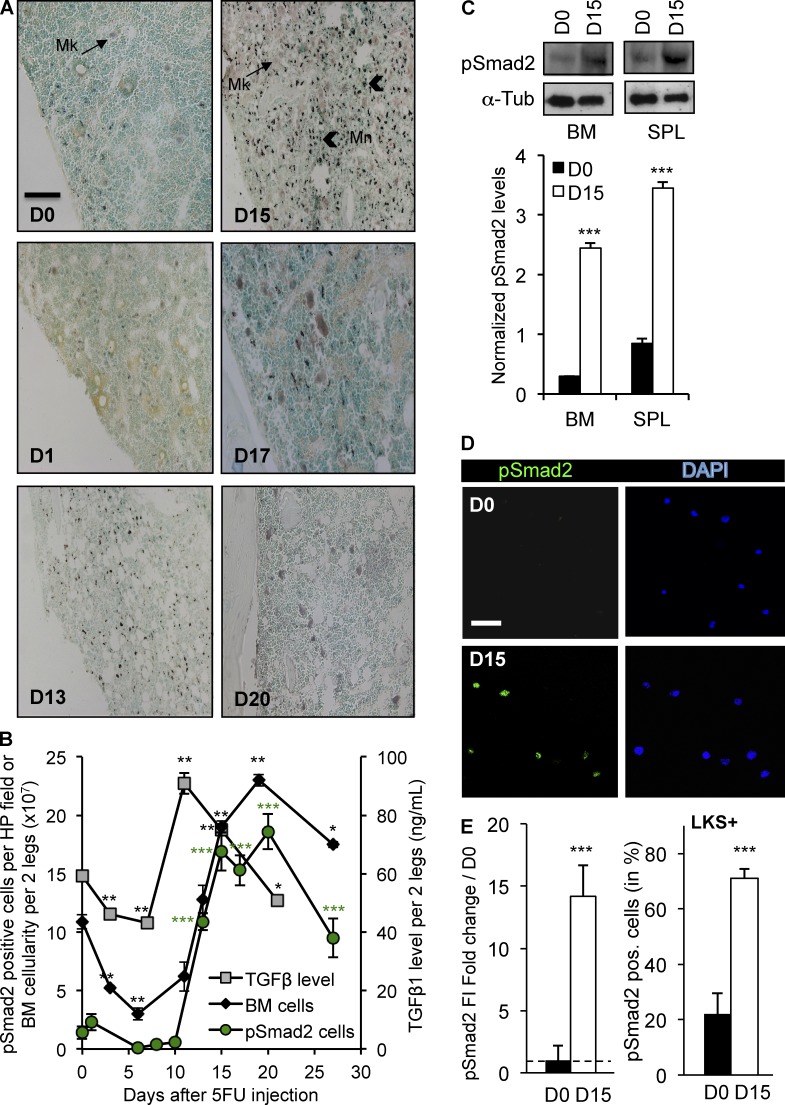
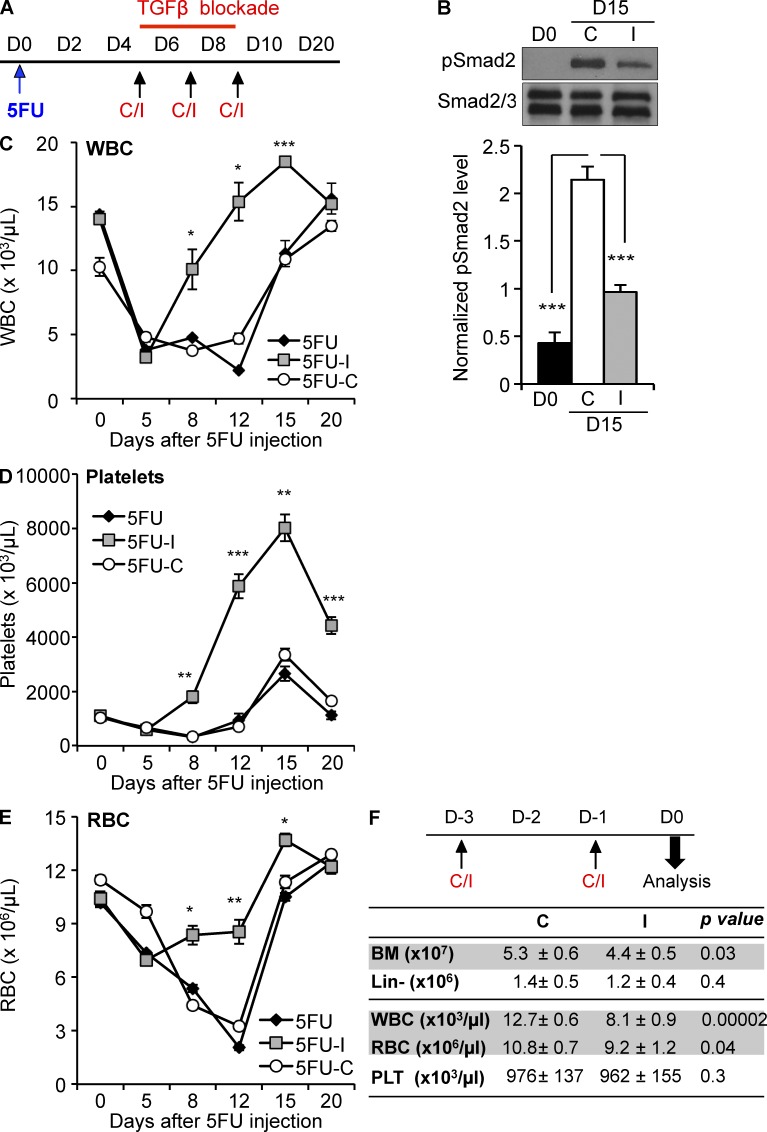
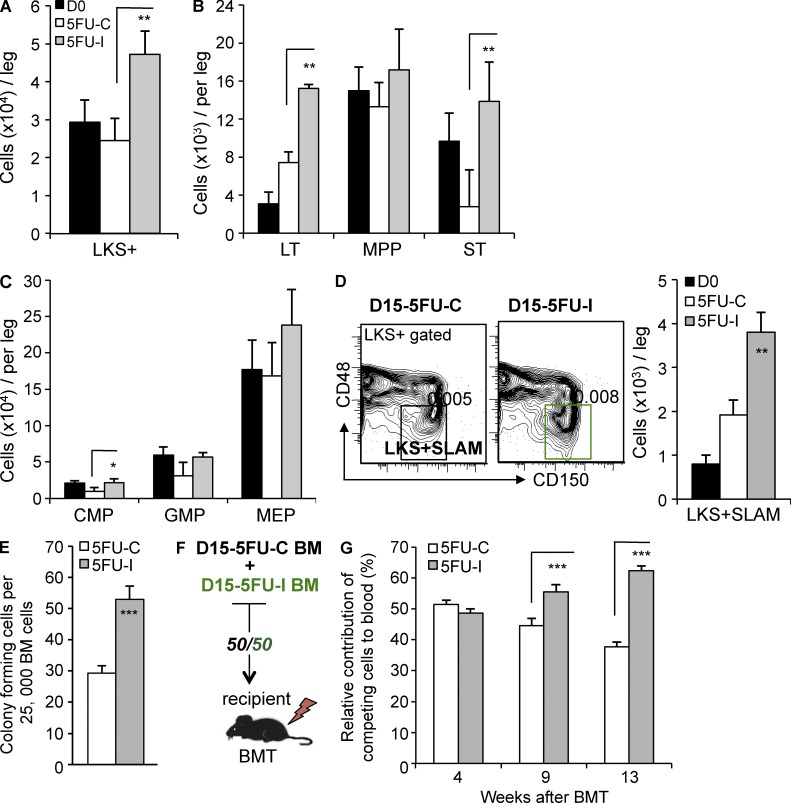
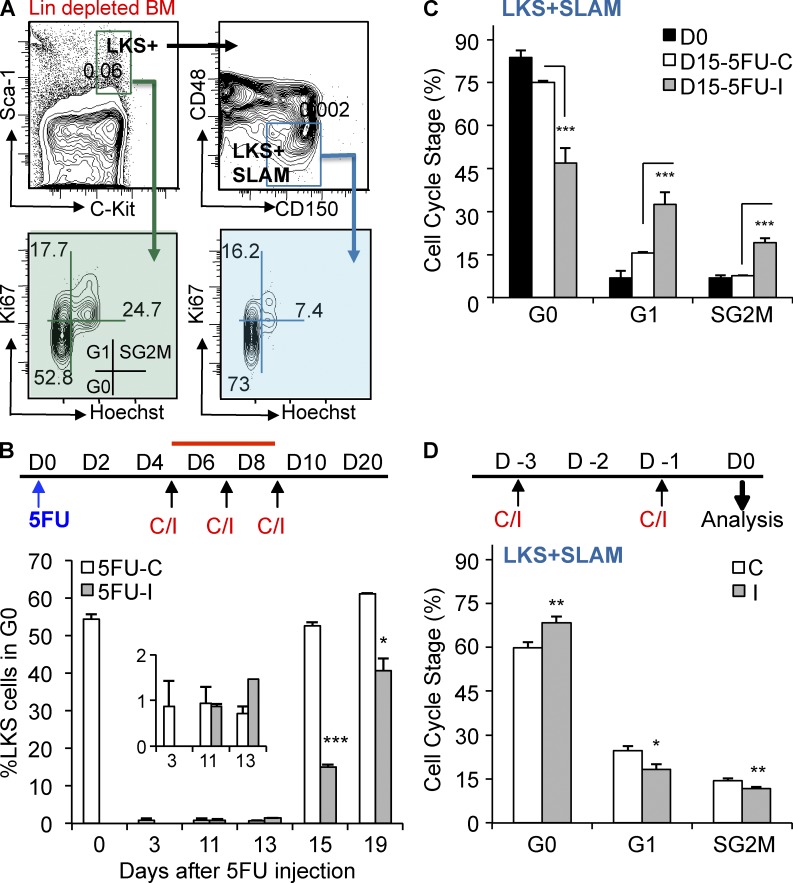
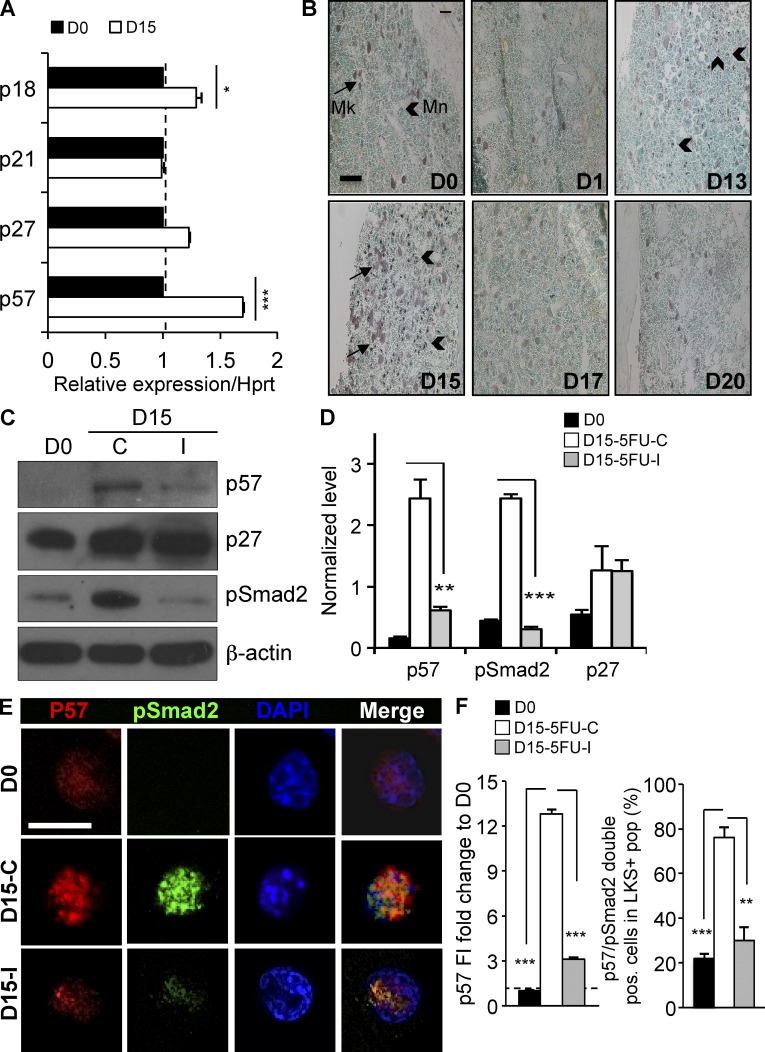
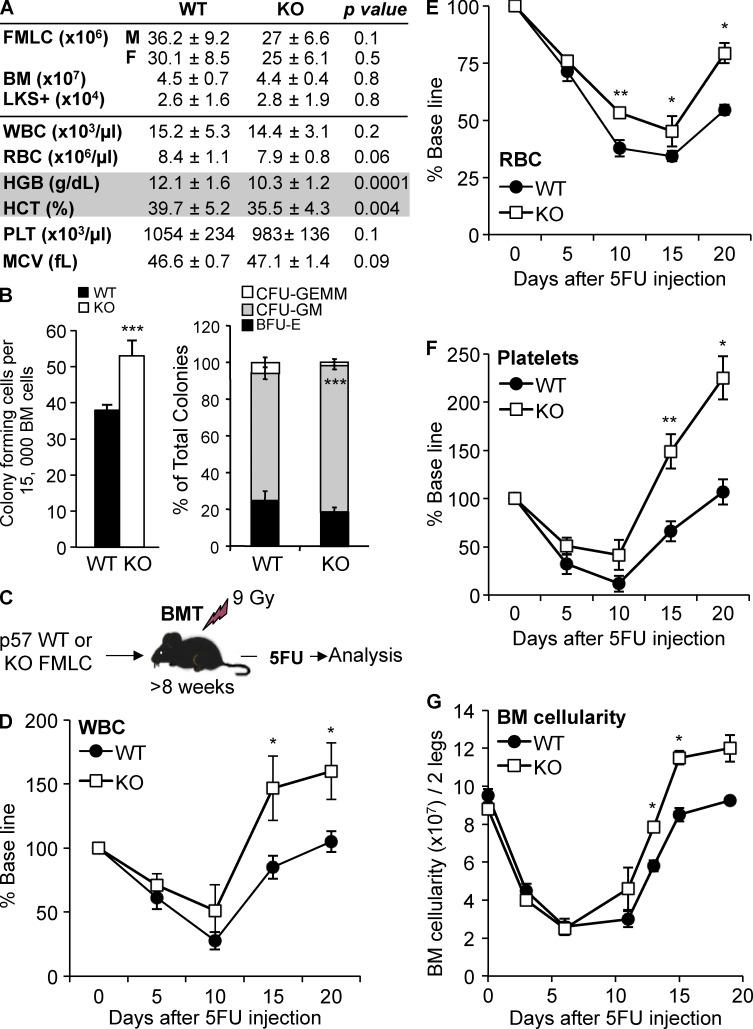
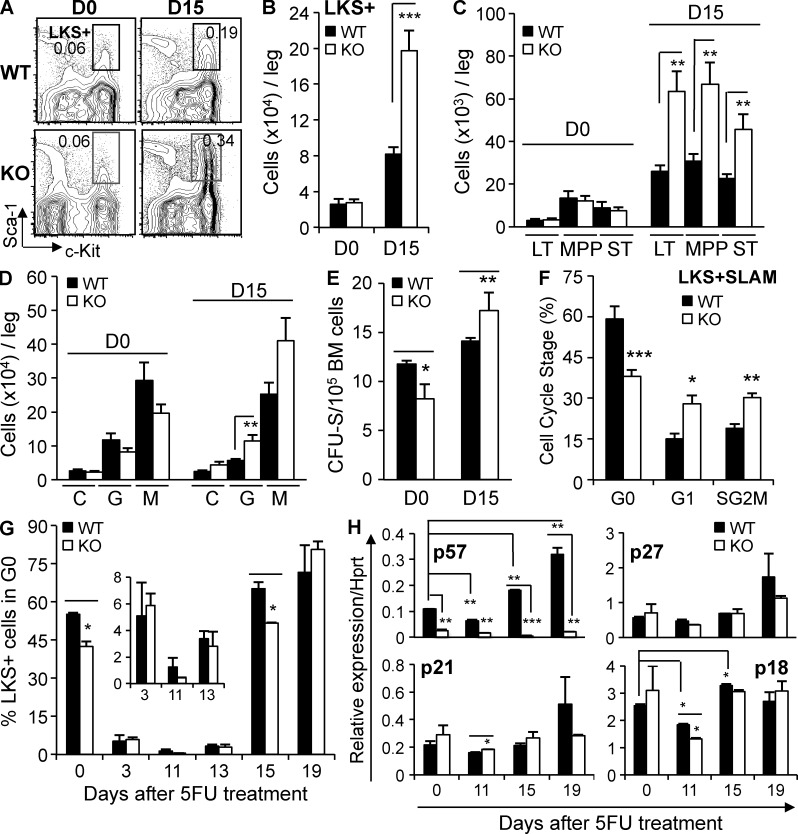
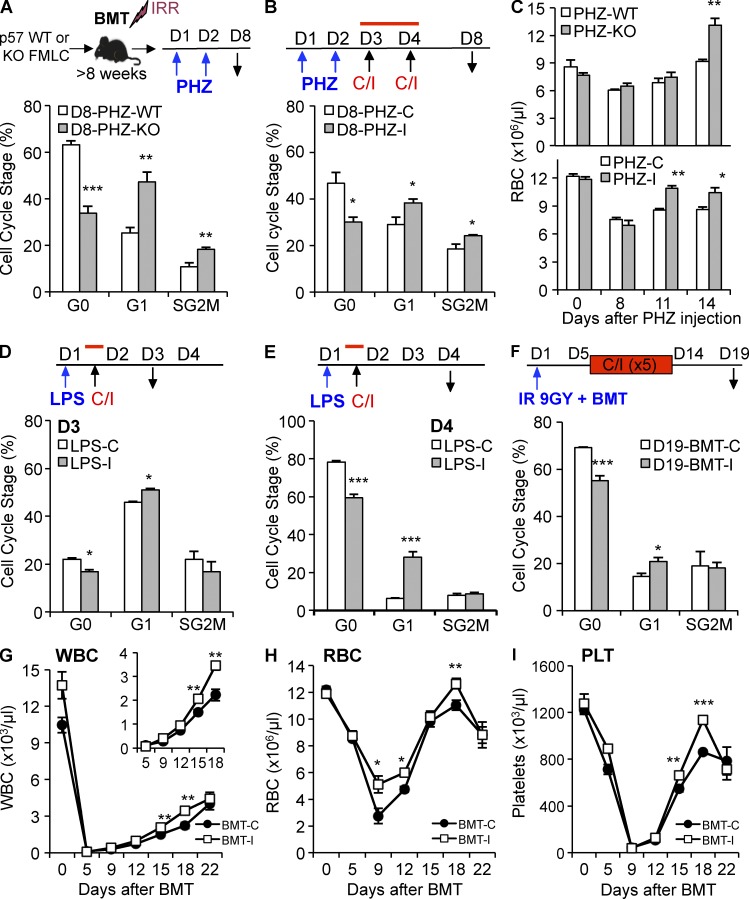
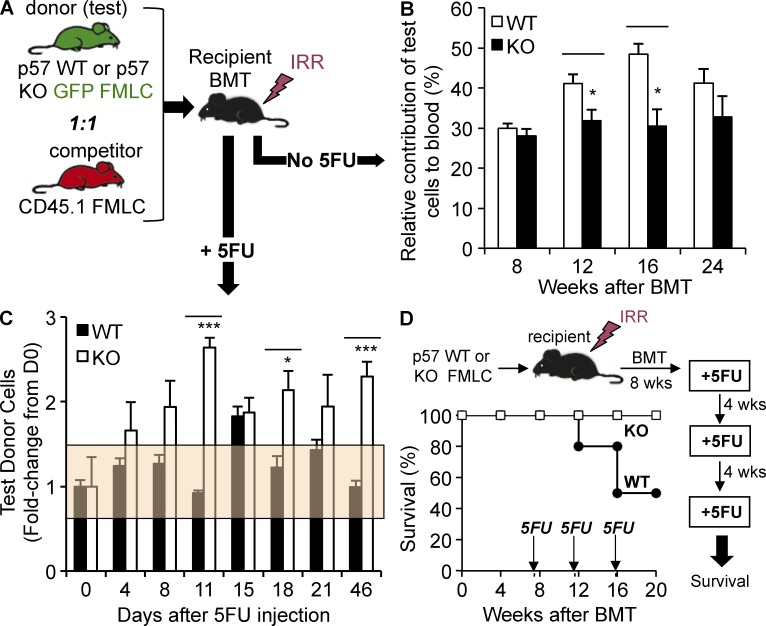
Myelosuppression is a life-threatening complication of antineoplastic therapy, but treatment is restricted to a few cytokines with unilineage hematopoietic activity. Although hematopoietic stem cells (HSCs) are predominantly quiescent during homeostasis, they are rapidly recruited into cell cycle by stresses, including myelosuppressive chemotherapy. Factors that induce HSCs to proliferate during stress have been characterized, but it is not known how HSC quiescence is then reestablished. In this study, we show that TGFβ signaling is transiently activated in hematopoietic stem and progenitor cells (HSPCs) during hematopoietic regeneration. Blockade of TGFβ signaling after chemotherapy accelerates hematopoietic reconstitution and delays the return of cycling HSCs to quiescence. In contrast, TGFβ blockade during homeostasis fails to induce cycling of HSPCs. We identified the cyclin-dependent kinase inhibitor Cdkn1c (p57) as a key downstream mediator of TGFβ during regeneration because the recovery of chimeric mice, incapable of expressing p57 in HSPCs, phenocopies blockade of TGFβ signaling after chemotherapy. This study demonstrates that context-dependent activation of TGFβ signaling is central to an unrecognized counterregulatory mechanism that promotes homeostasis once hematopoiesis has sufficiently recovered from myelosuppressive chemotherapy. These results open the door to new, potentially superior, approaches to promote multilineage hematopoietic recovery by blocking the TGFβ signaling that dampens regeneration.


Figures

Figure 1.
Figure 1.
TGFβ signaling is activated during BM recovery from chemotherapy. WT mice (n = 16) were treated with a single dose of 5FU (250 mg/kg, i.p.) on day 0. (A) IHC staining for pSmad2 was performed on BM sections collected before and after chemotherapy. Sections were counterstained with the nuclear stain, methyl green, to assess cellularity (bar, 100 µm). (B) ELISA measurement of active TGFβ in the BM (gray squares), quantification of pSmad2-positive cells per high-power (HP) IHC field (green circles) and BM cellularity (black diamonds) were assessed before (D0) and at the indicated times after chemotherapy. (C; top) Representative immunoblot of pSmad2 (∼55-kD) in Lin BM and spleen cells during homeostasis (D0) and during recovery from chemotherapy (D15). (bottom) Replicate blots were quantified using ImageJ and pSmad2 was normalized to the α-tubulin (∼50 kD) loading control (n = 3). (D) FACS-purified LKS+ cells were stained for pSmad2 (green) and DAPI (blue) on day 0 and 15 (bar, 50 µm). (E) pSmad2 fluorescence intensity (FI) was quantified using ImageJ software. The day 15/day 0 FI ratio (left) and the percentage of pSmad2+ LKS+ cells are shown at day 0 and 15 (right). All experiments were performed at least twice, usually three to five times. All quantified data are shown as mean ± SEM (*, P < 0.05; **, P < 0.01; ***, P < 0.001, or if undesignated, the comparison was not significant).
Figure 2.
Figure 2.
Blockade of TGFβ during recovery from chemotherapy promotes hematopoietic regeneration. (A) Cohorts of mice were treated with 5FU on day 0, and then with no additional agent (black diamonds, 5FU), the TGFβ-neutralizing antibody, 1D11 (gray squares, 5FU-I), or a nontargeted isotype control antibody, 13C4 (white circles, 5FU-C; n = 6) on day 5, 7, and 9 (arrows). (B; top) Representative immunoblot of pSmad2 in Lin BM during homeostasis (D0) and during recovery from chemotherapy (D15) with 1D11 (I) or 13C4 (C) antibody treatment. (bottom) Replicate blots were quantified using ImageJ and pSmad2 (∼55 kD) was normalized to the Smad2 band (top) of the Smad 2/3 (∼55/50 kD) loading control (n = 3). (C–F) Recovery of WBCs (C), platelets (D), and RBCs (E) is shown for treated mice (n = 6). (F) Cohorts of untreated, homeostatic mice (n = 10) were administered either the TGFβ-neutralizing antibody 1D11 (I; 10 mg/kg) or 13C4 control (C; 10 mg/kg) on days −3, −1 before analysis on day 0. Total BM cellularity and Lin-depleted cell count, WBCs, RBCs, and platelets (PLTs) were assessed after treatment. All quantified data are shown as mean ± SEM (*, P < 0.05; **, P < 0.01; ***, P < 0.001, or if undesignated, the comparison was not significant).
Figure 3.
Figure 3.
TGFβ limits HSPC proliferation after chemotherapy. (A–D) BM cell counts before (D0) and after (D15) treatment with 5FU and the TGFβ-neutralizing antibody, 1D11 (D15-I), or the control antibody (D15-C) were assessed by flow cytometry. Results were normalized per leg (femur + tibia) as indicated. Expansion of LKS+ (LincKit+Sca1+) cells (A), LKS+Flk2CD34 (LT), LKS+Flk2CD34+ (ST), and LKSFCRγII/IIIdimCD34+ CMPs and LKS + SLAM cells (D, right) is shown for untreated mice (black bars, D0) and mice treated with 5FU, and then 1D11 (gray bars, 5FU-I) or the control antibody (white bars, 5FU-C) during hematopoietic regeneration (n = 5). (D, left) Representative flow cytometry of LKS + SLAM (LKS+CD48CD150+) on day 15 after treatment with 5FU and either 1D11 (D15-I) or the control antibody (D15-C) is shown. (E) CFC assay for committed HPCs in D15-I BM and D15-C BM (n = 3). (F) Schematic of competitive repopulation analysis. EGFP or CD45.1-marked D15-C BMMC were mixed 1:1 with reciprocally marked D15-I BMMCs, and then transplanted into lethally irradiated recipient mice (n = 10). (G) Competitive repopulation by D15-C and D15-I cells of multilineage peripheral blood was analyzed by flow cytometry at the indicated times after transplantation (n = 10). All quantified data are shown as mean ± SEM (*, P < 0.05; **, P < 0.01; ***, P < 0.001, or if undesignated, the comparison was not significant).
Figure 4.
Figure 4.
Blockade of TGFβ during recovery from myelotoxic stress prolongs HSPC cycling. (A) Flow cytometry gating strategy for cell cycle analysis of LKS+ (LincKit+Sca1+) and LKS + SLAM (LincKit+Sca1+CD48CD150+) cells is shown (top images show frequency in total BM; bottom images show percentage of LKS + SLAM gated cells). (B) Mice were treated with 5FU, and then with the TGFβ-neutralizing antibody, 1D11 (5FU-I), or the isotype control antibody 13C4 (5FU-C) on day 5, 7, and 9. The percentage of quiescent LKS+ cells is shown before treatment (D0) and at various times after treatment with 5FU and 1D11 (5FU-I, gray bars) or the control antibody (5FU-C, white bars; n = 5/group). (C) Cell cycle status of BM LKS + SLAM HSCs is shown before (D0) and on day 15 after treatment with 5FU and 1D11 (5FU-I) or the control antibody (n = 5). (D) Cohorts of untreated, homeostatic mice (n = 10) were administered either the TGFβ-neutralizing antibody 1D11 (I; 10 mg/kg) or control antibody 13C4 (C; 10 mg/kg) on days −3 and −1 before analysis on day 0. Bivariate cell cycle status of BM LKS + SLAM HSC on day 0 is shown. All quantified data are shown as mean ± SEM (*, P < 0.05; **, P < 0.01; ***, P < 0.001, or if undesignated, the comparison was not significant).
Figure 5.
Figure 5.
TGFβ is required for p57 up-regulation during recovery from myelosuppressive chemotherapy. (A) The expression of CDKIs in Lin BM cells of C57BL/6J mice before (D0) or after (D15) administration of 5FU (250 mg/kg, i.p.) was assessed by qRT-PCR. Expression of p57, p21, p18, and p27 mRNA was normalized to Hprt1 at each time point (n = 3). (B) Wild-type mice were killed before (D0) and at the indicated times after a single dose of 5FU chemotherapy. Femurs were stained by IHC for p57 and nuclei were counterstained with Methyl Green. p57 staining was seen in both megakaryocytes (Mk, small arrows) and small mononuclear cells (Mn, large arrow heads). Expression of p57 (reddish-brown) was maximally up-regulated 15 d after 5FU treatment (bar, 100 µm). (C) Cohorts of mice were treated with 5FU on day 0, and then with the TGFβ-neutralizing antibody 1D11 or a nontargeted control antibody 13C4 on day 5, 7, and 9. Immunoblots are shown for p57 (∼51 kD), pSmad2 (∼55 kD), and p27 (∼27 kD), in Lin BM cells. (D) Replicate blots were quantified using ImageJ and expression normalized to β-actin (∼45 kD; n = 3). (E) LKS+ cells were FACS purified from mice before (D0), and on day 15 after 5FU chemotherapy, followed by either 1D11 (D15-I) or 13C4 (D15-C), as described previously. Purified cells were stained for p57 (red), pSmad2 (green), and for DNA using DAPI (blue). Images were acquired using a Zeiss 710 laser scanning confocal microscope and (F) fluorescence intensity (FI) was quantified using ImageJ software (bar, 10 µm). All quantified data are shown as mean ± SEM (*, P < 0.05; **, P < 0.01; ***, P < 0.001, or if undesignated, the comparison was not significant).
Figure 6.
Figure 6.
p57-KO HSPCs recover more robustly after myelosuppressive chemotherapy. (A) Table comparing hematologic parameters for p57-WT and p57-KO hematopoiesis. FLMCs were harvested from littermates and transplanted into lethally irradiated (9 Gr) C57BL/6 recipients to assess adult hematopoiesis. Once steady-state hematopoiesis was reached (≥12 wk), BM LKS+ cells were enumerated by flow cytometry and normalized to cells per leg (n = 5 for each genotype). Blood cell counts (n = 20) are shown for WT and KO-transplanted mice after they reached homeostasis (>12 wk). BM, total BM cellularity, WBC, white blood cells; RBC, red blood cells; HGB, hemoglobin; HCT, hematocrit; PLT, platelets; MCV, Mean Corpuscular Volume. (B) CFC assay for committed HPCs is shown for chimeric mice with p57-WT (black bars) and p57-KO (white bars) BM cells. Total CFCs, CFU-GM (CFU-granulocyte, macrophage), CFU-GEMM (CFU-granulocyte, erythrocyte, macrophage, megakaryocyte), and BFU-E (Burst forming unit-erythroid) are presented in the graph (n = 3 in triplicate for each genotype). (C) Littermate FLMCs were isolated from p57-WT or p57-KO embryos and transplanted into lethally irradiated C57BL/6J recipient mice (n = 10). Once homeostasis was reached (∼10 wk), recipient mice were treated with a single myelosuppressive dose of 5FU (150 mg/kg, i.p) as indicated. Peripheral blood WBCs (D), RBCs (E), platelets (F), and BM cellularity (G) are shown for chimeric mice with p57-WT (black circles) and p57-KO (white squares) hematopoiesis. All quantified data are shown as mean ± SEM (*, P < 0.05; **, P < 0.01; ***, P < 0.001, or if undesignated, the comparison was not significant).
Figure 7.
Figure 7.
p57-KO hematopoiesis phenocopies inhibition of TGFβ signaling during BM regeneration. (A) Representative multidimensional flow cytometry of p57-WT and p57-KO BM LKS+ cells is shown before treatment (D0) and day 15 after treatment with 5FU (frequency in total BM). (B and C) Flow cytometric enumeration of LKS+ (LincKit+Sca1+) cells, and LKS+Flk2CD34 (LT), LKS+Flk2CD34+ (ST), LKS+Flk2+CD34+ (MPP) subpopulations (n = 5) is shown before (D0) and during hematopoietic regeneration (D15). (D) Immunophenotypic CMP (C), GMP (G) and MEP (M) is shown before (D0) and after (D15) chemotherapy (n = 5). (E) Expansion of immature MPPs was functionally validated using the CFU-S assay (n = 3). (F) Bi-dimensional cell cycle analysis is shown for p57-KO LKS + SLAM cells isolated during regeneration (D15) from chimeric mice with p57-WT (black bars) or p57-KO (white bars) hematopoiesis. (G) The population of quiescent LKS+ cells before treatment (D0) and at various times after treatment with 5FU is shown. (H) Expression of p57, p21, p18, and p27 mRNA in Lin BM cells of p57-WT and p57-KO recipients was assessed by qRT-PCR before and at the indicated times after chemotherapy administration. Expression was normalized to Hprt1 at each time point (n = 3). All quantified data are shown as mean ± SEM (*, P < 0.05; **, P < 0.01; ***, P < 0.001, or if undesignated, the comparison was not significant).
Figure 8.
Figure 8.
Blockade of TGFβ during recovery from hematologic stress prolongs HSPC cycling. (A) Chimeric mice with p57-WT or p57-KO hematopoiesis were injected with phenylhydrazine hydrochloride (PHZ) on day 1 and 2, and then killed on day 8 for LKS + SLAM cell cycle analysis. (B) C57BL/6J mice were injected with PHZ as previously described, and then with either the TGFβ-neutralizing antibody 1D11 (PHZ-I) or control antibody 13C4 (PHZ-C) on day 3 and 4 before analysis on day 8. (C) Chimeric mice with either p57-WT or p57-KO hematopoiesis (top) and C57BL/6J mice (bottom) were treated with PHZ as described, and RBC recovery was monitored during recovery. (D and E) C57BL/6J mice were injected with LPS on day 1, and then with either 1D11 (LPS-I) or 13C4 (LPS-C) 6 h later. Cell cycle status of LKS + SLAM cells was analyzed on day 3 (D) and 4 (E) after LPS administration. (F–I) Lethally irradiated mice were transplanted with 2 × 10⁶ WT BM cells on day 1 and administered either 1D11 (BMT-I) or 13C4 (BMT-C) on day 7, 9, 11, and 14 after transplantation. Mice were sacrificed on day 19 for LKS + SLAM cell cycle analysis (F). Recovery of blood WBCs (G), RBCs (H), and PLTs (I) was monitored over time for transplanted mice treated with either 1D11 (BMT-I, white squares) or 13C4 (BMT-C, black circles). All quantified data are shown as mean ± SEM (*, P < 0.05; **, P < 0.01; ***, P < 0.001, or if undesignated, the comparison was not significant).
Figure 9.
Figure 9.
Hematopoietic stress confers a competitive advantage to p57-KO HSCs. (A) Schematic representation of competitive repopulation analysis. CD45.1+ control FLMCs were mixed 1:1 with a test population of either p57-WT or p57-KO FLMCs (EGFP+/+), and then transplanted into lethally irradiated recipient mice (n = 10). Stably engrafted mice with p57-WT or p57-KO hematopoiesis were analyzed at steady state (B) or after chemotherapy (C). (B) Multilineage peripheral blood engraftment was analyzed by flow cytometry at the indicated times after reconstitution to assess the proportion of p57-WT or p57-KO cells (n = 10). (C) To study the effect of myelosuppressive stress in competitively transplanted recipient mice, recipients were allowed to reach homeostasis (10 wk), and then given a single dose of myelosuppressive chemotherapy. Multilineage engraftment was assessed as described previously to monitor the relative contribution of p57-WT or p57-KO hematopoiesis during regeneration (n = 10). The percentage of donor cells was normalized to the day 0 measure for each mouse. The orange box represents the standard deviation of the day 0 measurements. (D) Kaplan-Meier survival curve is shown for chimeric mice stably engrafted with p57-WT or p57-KO hematopoiesis (n = 10), and then cyclically treated every 4 wk with a myelosuppressive dose of 5FU. All quantified data are shown as mean ± SEM (*, P < 0.05; **, P < 0.01; ***, P < 0.001, or if undesignated, the comparison was not significant).

References

    1. Annes J.P., Munger J.S., Rifkin D.B. 2003. Making sense of latent TGFbeta activation. J. Cell Sci. 116:217–224 10.1242/jcs.00229 - DOI - PubMed
    1. Barcellos-Hoff M.H., Dix T.A. 1996. Redox-mediated activation of latent transforming growth factor-beta 1. Mol. Endocrinol. 10:1077–1083 10.1210/me.10.9.1077 - DOI - PubMed
    1. Batard P., Monier M.N., Fortunel N., Ducos K., Sansilvestri-Morel P., Phan T., Hatzfeld A., Hatzfeld J.A. 2000. TGF-(beta)1 maintains hematopoietic immaturity by a reversible negative control of cell cycle and induces CD34 antigen up-modulation. J. Cell Sci. 113:383–390 - PubMed
    1. Biswas S., Guix M., Rinehart C., Dugger T.C., Chytil A., Moses H.L., Freeman M.L., Arteaga C.L. 2007. Inhibition of TGF-beta with neutralizing antibodies prevents radiation-induced acceleration of metastatic cancer progression. J. Clin. Invest. 117:1305–1313 10.1172/JCI30740 - DOI - PMC - PubMed
    1. Blank U., Karlsson S. 2011. The role of Smad signaling in hematopoiesis and translational hematology. Leukemia. 25:1379–1388 10.1038/leu.2011.95 - DOI - PubMed

Publication types

MeSH terms

Substances