Clinical Trial
. 2013 Mar 12;110(11):4339-44.
doi: 10.1073/pnas.1217602110. Epub 2013 Feb 25.

PML mediates glioblastoma resistance to mammalian target of rapamycin (mTOR)-targeted therapies

Affiliations
Clinical Trial

PML mediates glioblastoma resistance to mammalian target of rapamycin (mTOR)-targeted therapies

Akio Iwanami et al. Proc Natl Acad Sci U S A. .

Abstract

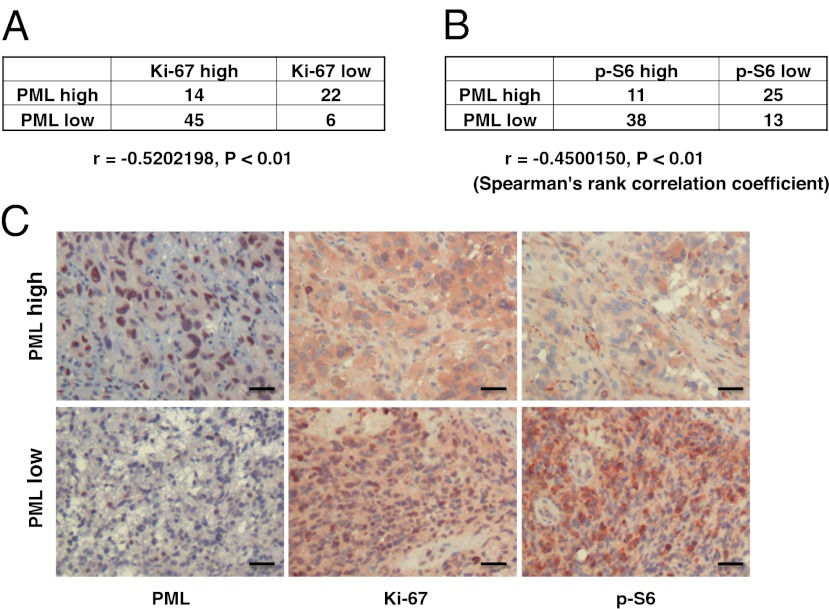
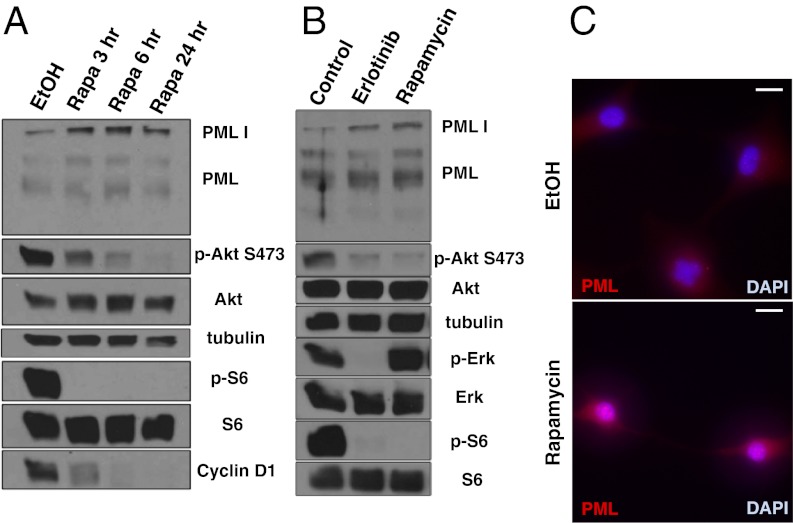
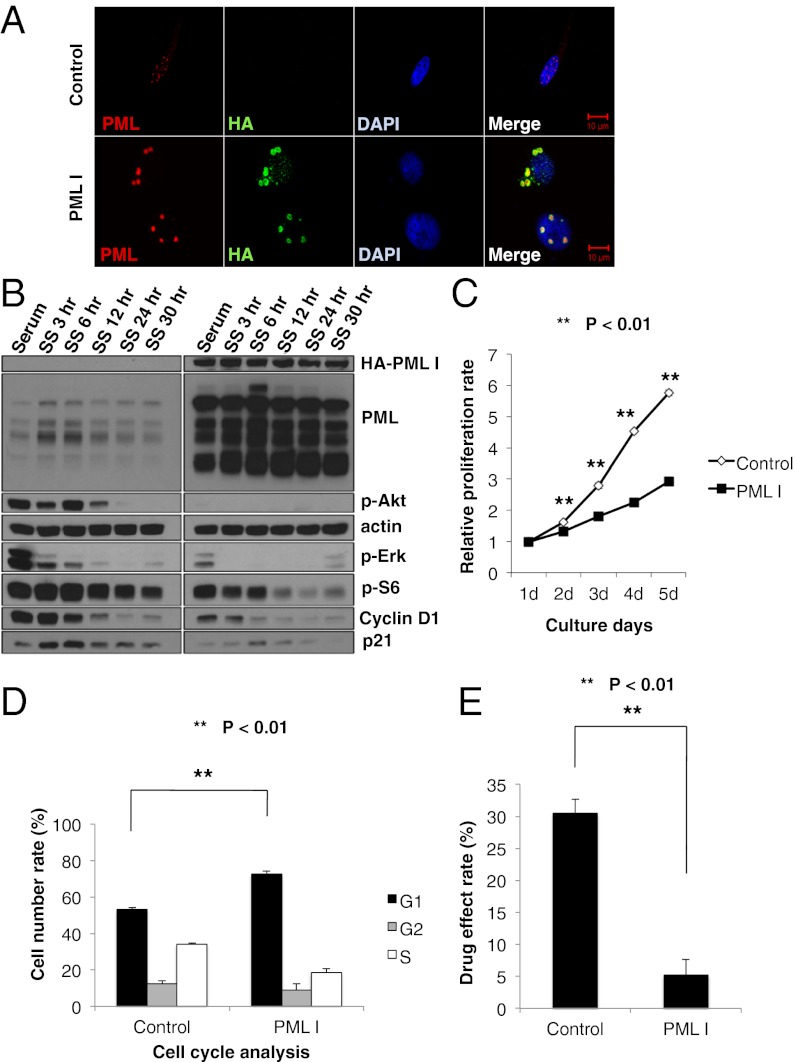
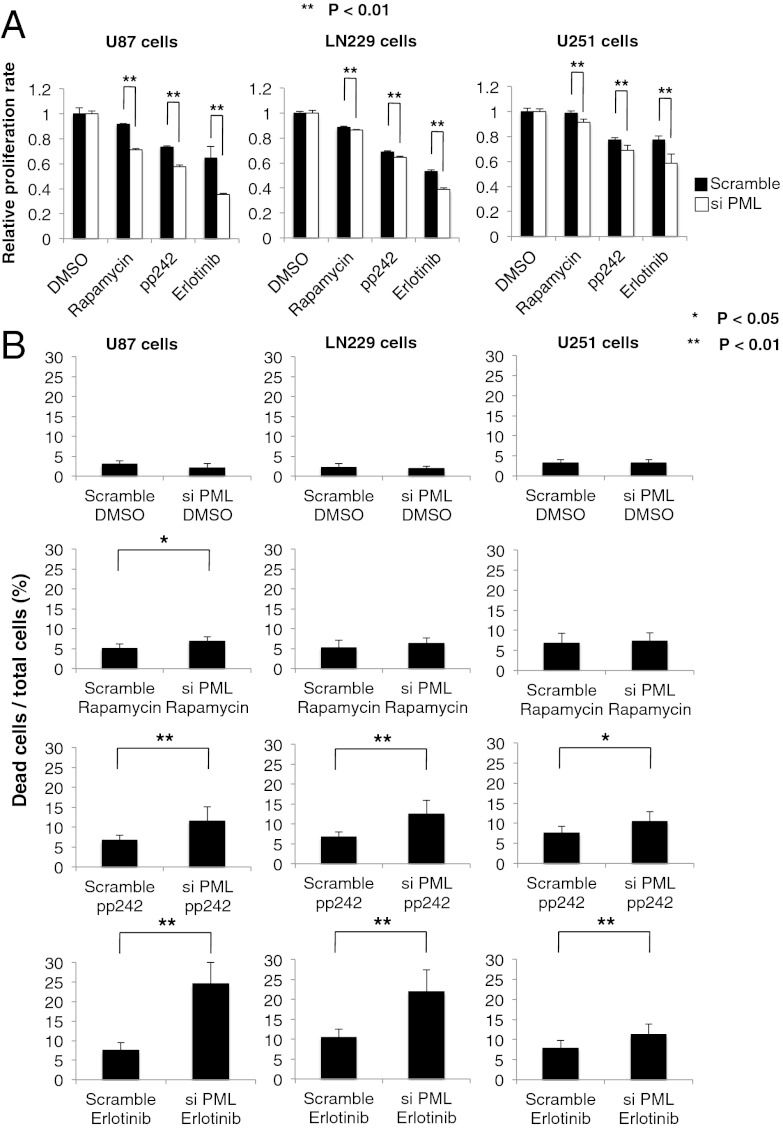
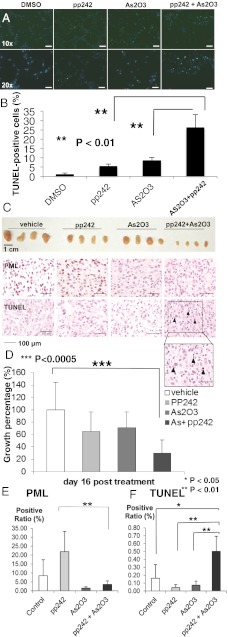
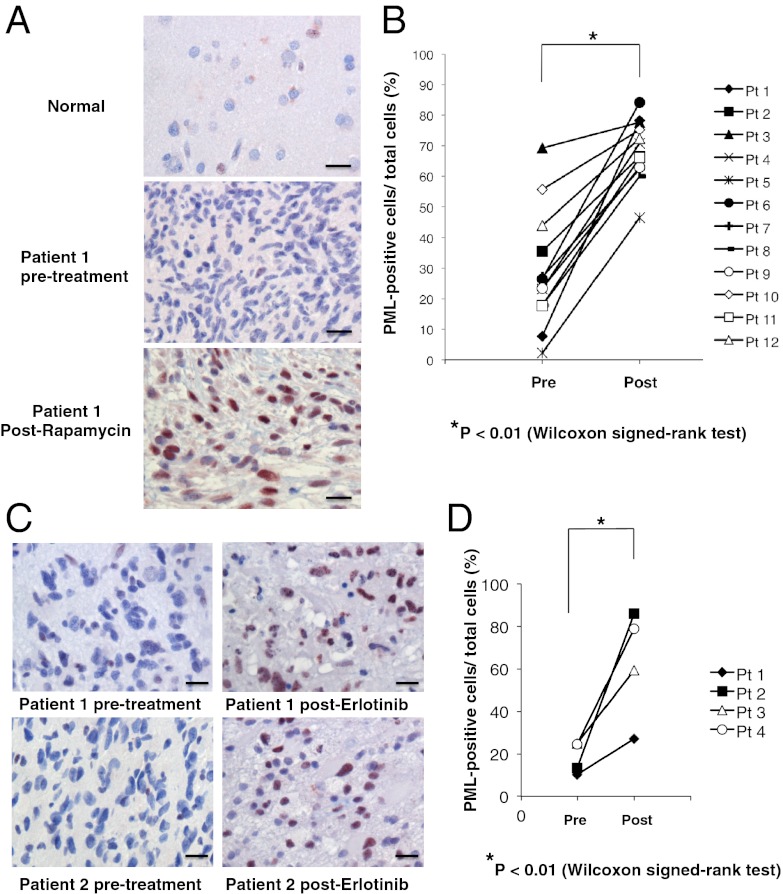
Despite their nearly universal activation of mammalian target of rapamycin (mTOR) signaling, glioblastomas (GBMs) are strikingly resistant to mTOR-targeted therapy. We analyzed GBM cell lines, patient-derived tumor cell cultures, and clinical samples from patients in phase 1 clinical trials, and find that the promyelocytic leukemia (PML) gene mediates resistance to mTOR-targeted therapies. Direct mTOR inhibitors and EGF receptor (EGFR) inhibitors that block downstream mTOR signaling promote nuclear PML expression in GBMs, and genetic overexpression and knockdown approaches demonstrate that PML prevents mTOR and EGFR inhibitor-dependent cell death. Low doses of the PML inhibitor, arsenic trioxide, abrogate PML expression and reverse mTOR kinase inhibitor resistance in vivo, thus markedly inhibiting tumor growth and promoting tumor cell death in mice. These results identify a unique role for PML in mTOR and EGFR inhibitor resistance and provide a strong rationale for a combination therapeutic strategy to overcome it.


Conflict of interest statement

The authors declare no conflict of interest.

Figures

Fig. 1.
Fig. 1.
PML is inversely correlated with proliferation rate and mTOR signaling in GBM clinical samples. (A and B) Tissue microarrays containing tumor samples from 87 GBM patients were stained by using PML, Ki-67, and p-S6 antibody, respectively. PML is highly expressed in 40% of GBM patients. Correlation analyses show PML significantly inversely correlate with Ki-67 (A) and p-S6 (B). (C) Immunohistochemical staining of (reddish brown) PML, Ki-67, and p-S6 from a representative GBM patient. (Magnification: 10×.) Nuclei were counterstained with hematoxylin (blue). (Scale bar: 100 μm.)
Fig. 2.
Fig. 2.
PI3K/Akt/mTOR inhibitors induce PML expression in GBM cells. (A) Western blot analysis of the effect of rapamycin treatment on PML expression in U87 cells. Cells are cultured in serum-free condition. (B) Effect of the EGFR inhibitor erlotinib and rapamycin on PML expression in GBM patient-derived cells. Cells are cultured under neurosphere conditions. (C) Immunofluorescence of PML (red) in U87 cells treated with rapamycin or control. Nuclei are stained with DAPI (blue). (Scale bar: 20 μm.)
Fig. 3.
Fig. 3.
PML overexpression decreases PI3K/Akt/mTOR signaling and slows down cell cycle. (A) Immunofluorescence in U87 control or hemagglutanin-tagged PML1 (HA-PMLI) infected cells. (Scale bar: 10 μm.) (B) Western blot analysis of PI3K/Akt/mTOR signaling pathway and cell cycle-related proteins performed on lysates from U87 control or HA-PMLI infected cells. Cells were placed in serum-free medium, cultured, and collected in each time course. (C) Proliferation of U87 control and HA-PMLI infected cells analyzed by WST assay. P value was determined by Student’s t test. (D) Effect of PMLI overexpression on cell cycle progression in U87 cells. Cell cycle distribution was performed by flow cytometric analysis. P value was determined by Student's t test. (E) Effect of treatment with rapamycin on growth of U87 control and HA-PMLI infected cells analyzed by WST assay. P value was determined by Student's t test.
Fig. 4.
Fig. 4.
PML knockdown sensitizes GBM cell lines to EGFR and mTOR targeted therapies. (A) Cell viability assays demonstrate a synergistic effect of PML knockdown and each indicated inhibitor. P values were determined by Student’s t test. (B) Effect of PML knockdown and each indicated inhibitor on multiple GBM cell lines analyzed by Trypan blue exclusion. P values were determined by Student’s t test.
Fig. 5.
Fig. 5.
As2O3 reduces PML and sensitizes GBM cells to mTOR-targeted therapies. (A) Representative images demonstrating TUNEL staining (green) to assess apoptotic effect of pp242 and As2O3 (2 μM) on U87 cells in vitro. Nuclei are stained blue. (B) Quantification of TUNEL staining. P values were determined by Student’s t test. (C) Representative photographs of U87 GBM xenografts treated daily with vehicle, pp242 (60 mg/kg per day by oral gavage), As2O3 (2.5 mg/kg intraperitoneally), or combination (n = 8 mice per condition). Images of representative PML and TUNEL stains. (D) Quantification demonstrating greater than threefold reduction in tumor size for mice treated with combined pp242 and As2O3 (P < 0.005). (E and F) Quantification of PML and TUNEL xenograft tumor staining from each treatment conditions.
Fig. 6.
Fig. 6.
Rapamycin and erlotinib treatment induces PML expression in GBM patient tumor tissues. (A) Immunohistochemical staining (reddish brown) of PML before and after treatment with rapamycin. Nuclei were counterstained with hematoxylin (blue). (B) Quantification of immunohistochemical staining from >1,000 cells from at least three representative areas of each tumor before and after rapamycin treatment. P value was determined by Wilcoxon signed-rank test. (C) Immunohistochemical staining (reddish brown) of PML before and after treatment with erlotinib. Nuclei were counterstained with hematoxylin (blue). (D) Quantification of immunohistochemical staining from >1,000 cells from at least three representative areas of each tumor before and after erlotinib treatment. P value was determined by Wilcoxon signed-rank test. (Scale bars: 50 μm.) (Magnification: 20×.)

References

    1. Furnari FB, et al. Malignant astrocytic glioma: Genetics, biology, and paths to treatment. Genes Dev. 2007;21(21):2683–2710. - PubMed
    1. Wen PY, Kesari S. Malignant gliomas in adults. N Engl J Med. 2008;359(5):492–507. - PubMed
    1. Anonymous Cancer Genome Atlas Research Network Comprehensive genomic characterization defines human glioblastoma genes and core pathways. Nature. 2008;455(7216):1061–1068. - PMC - PubMed
    1. Parsons DW, et al. An integrated genomic analysis of human glioblastoma multiforme. Science. 2008;321(5897):1807–1812. - PMC - PubMed
    1. Yecies JL, Manning BD. Transcriptional control of cellular metabolism by mTOR signaling. Cancer Res. 2011;71(8):2815–2820. - PMC - PubMed

Publication types

MeSH terms