. 2013 Mar 26;110(13):5064-8.
doi: 10.1073/pnas.1218042110. Epub 2013 Feb 25.

Species distributions in response to individual soil nutrients and seasonal drought across a community of tropical trees

Affiliations

Species distributions in response to individual soil nutrients and seasonal drought across a community of tropical trees

Richard Condit et al. Proc Natl Acad Sci U S A. .

Abstract

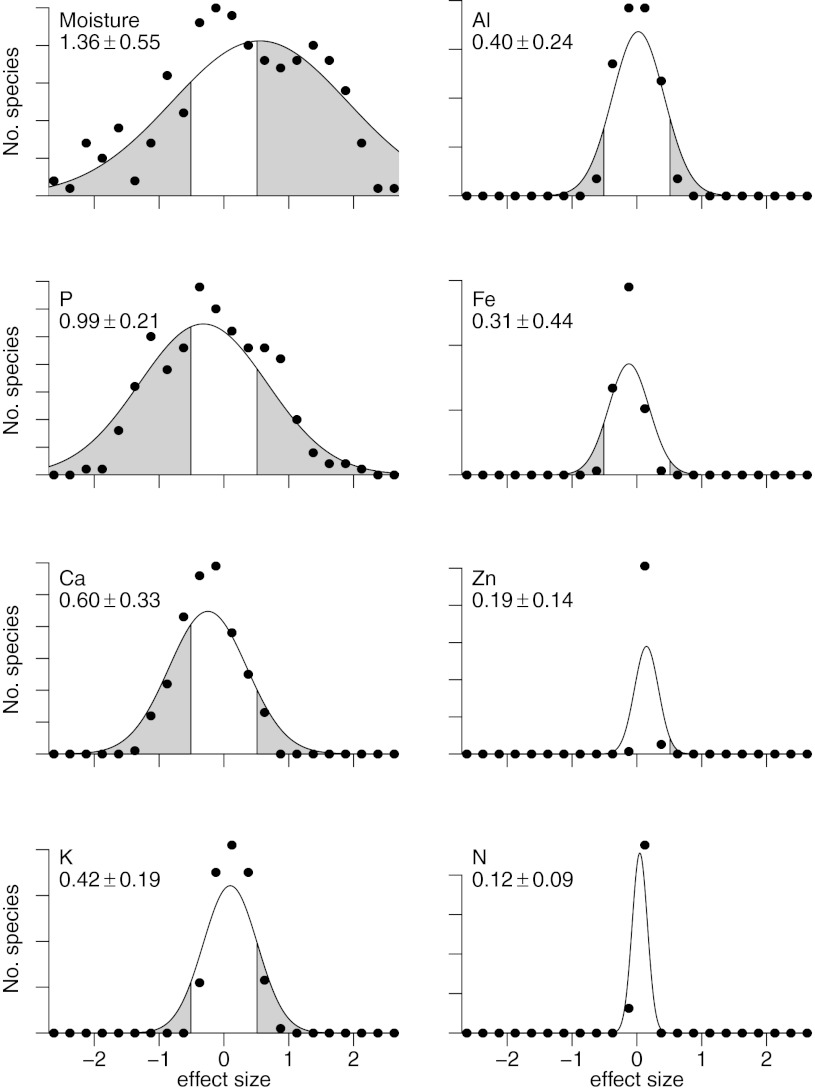
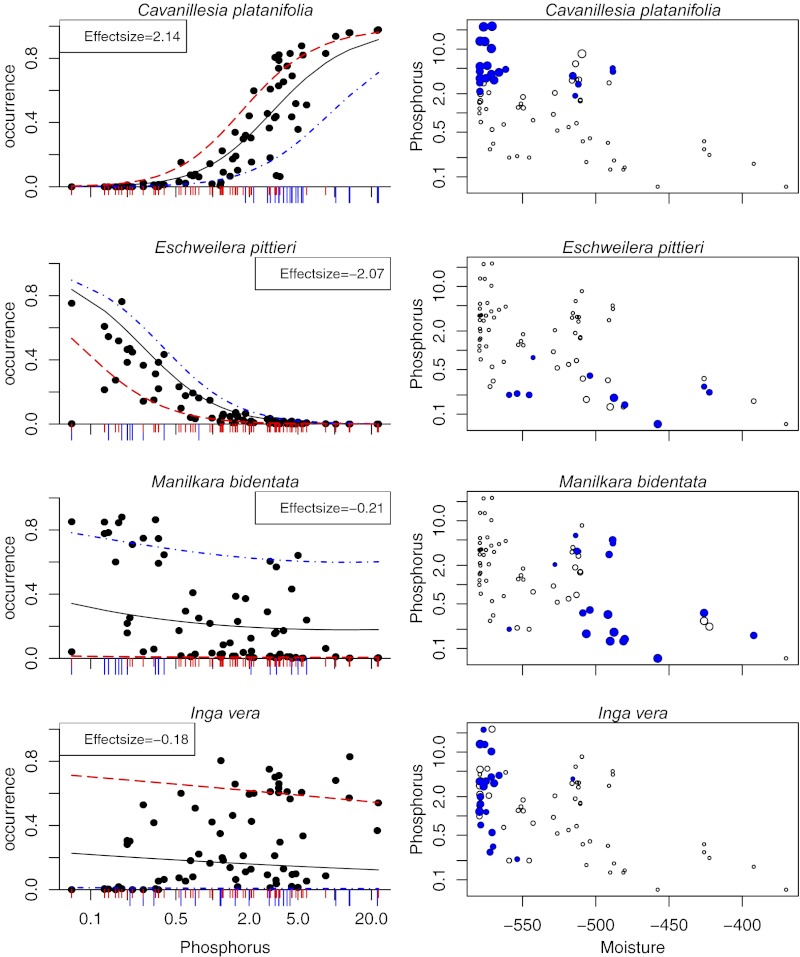
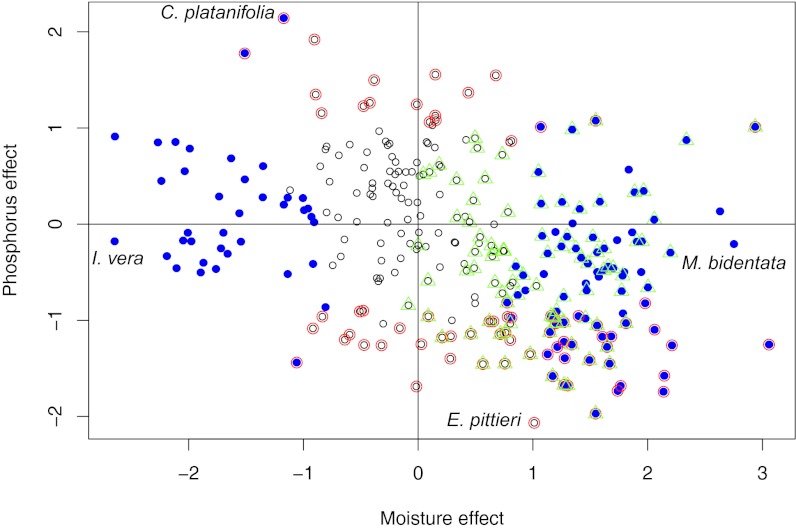
Tropical forest vegetation is shaped by climate and by soil, but understanding how the distributions of individual tree species respond to specific resources has been hindered by high diversity and consequent rarity. To study species over an entire community, we surveyed trees and measured soil chemistry across climatic and geological gradients in central Panama and then used a unique hierarchical model of species occurrence as a function of rainfall and soil chemistry to circumvent analytical difficulties posed by rare species. The results are a quantitative assessment of the responses of 550 tree species to eight environmental factors, providing a measure of the importance of each factor across the entire tree community. Dry-season intensity and soil phosphorus were the strongest predictors, each affecting the distribution of more than half of the species. Although we anticipated clear-cut responses to dry-season intensity, the finding that many species have pronounced associations with either high or low phosphorus reveals a previously unquantified role for this nutrient in limiting tropical tree distributions. The results provide the data necessary for understanding distributional limits of tree species and predicting future changes in forest composition.


Conflict of interest statement

The authors declare no conflict of interest.

Figures

Fig. 1.
Fig. 1.
Histograms of individual species responses to eight environmental factors. The horizontal axis is the effect size, b, defined as the first-order parameter of the logistic model. The shaded portions of each curve highlight species with strong responses (|b| > 0.5; Table 1). The curves are fitted hyperdistributions of b; the fitted SD (hyper-SD) of b with its credible interval is noted. Points give the observed number of species within bins of width 0.25 (i.e., the observed hyperdistribution), including just the 271 species with ≥10 occurrences. Moisture, dry-season moisture; P, plant-available (resin) phosphorus; N, inorganic nitrogen (Table S1 and SI Materials and Methods).
Fig. 2.
Fig. 2.
Responses of four species to plant-available (resin) phosphorus and dry-season moisture. (Left) Graphs show occurrence probability per site (y axis) as a function of phosphorus concentration (x axis) (milligrams per kilogram, log scale). The solid curve is the logistic model’s prediction of the species response to phosphorus (the modeled occurrence when phosphorus is varied), whereas the other seven predictors are held constant at their means. The dashed curve (red) is the response to phosphorus under dry conditions (1 SD below mean moisture), whereas the remaining factors are held at their means. The dotted-dashed curve (blue) is the response to phosphorus under wet conditions (1 SD above mean moisture), whereas the remaining factors are held at their means. The black points are the modeled response when all eight factors were varied, the model’s best prediction at each site. Below the x axis, blue bars show where a species was observed and red bars shown where it was absent. The four species were chosen to illustrate a range of joint moisture-phosphorus responses: C. platanifolia had a strong positive response to phosphorus and to drier conditions; E. pittieri was associated with low phosphorus and high moisture; Manilkara bidentata and Inga vera were indifferent to phosphorus but had opposing moisture responses, with the former occurring with high moisture and the latter with low moisture. The effect size noted for each species is the first-order logistic parameter for phosphorus, bP, with bP > 0 meaning a species associated with high phosphorus. (Right) Graphs show phosphorus concentration (milligrams per kilogram, log scale) plotted against dry-season moisture (millimeters) at all 72 sites, with filled circles (blue) showing where each species was observed. A more negative dry season had less moisture (SI Materials and Methods). The size of the points indicates the model prediction for each species, based on all eight factors, with larger circles having a higher predicted occurrence. C. platanifolia and E. pittieri were perfectly segregated by phosphorus but overlapped considerably on the moisture gradient. M. bidentata and I. vera were segregated by moisture but not phosphorus.
Fig. 3.
Fig. 3.
Quantitative responses to dry-season moisture and plant-available (resin) phosphorus for individual species. Response is measured by the effect size, b (Fig. 1); b > 0 means a species associated with high moisture or high phosphorus. Solid blue points are statistically significant effects relative to moisture; open red circles are significant relative to phosphorus. The green triangles indicate species with a significant modal response to moisture. Only species with ≥10 occurrences are included. Species identified are those whose individual responses are shown in Fig. 2. There is a weak but significant negative correlation between the two responses (r2 = 0.10).

Comment in

References

    1. Condit R, Hubbell SP, Foster RB. Mortality rates of 205 neotropical tree and shrub species and the impact of a severe drought. Ecol Monogr. 1995;65(4):419–429.
    1. Leigh EG. Tropical Forest Ecology: A View from Barro Colorado Island. New York: Oxford Univ Press; 1999.
    1. Wright SJ. Plant diversity in tropical forests: A review of mechanisms of species coexistence. Oecologia. 2002;130(1):1–14. - PubMed
    1. Condit R, et al. The importance of demographic niches to tree diversity. Science. 2006;313(5783):98–101. - PubMed
    1. Engelbrecht BMJ, et al. Drought sensitivity shapes species distribution patterns in tropical forests. Nature. 2007;447(7140):80–82. - PubMed

Publication types