. 2013 Apr;42(4):1219-28.
doi: 10.3892/ijo.2013.1835. Epub 2013 Feb 21.

DFMO/eflornithine inhibits migration and invasion downstream of MYCN and involves p27Kip1 activity in neuroblastoma

Affiliations

DFMO/eflornithine inhibits migration and invasion downstream of MYCN and involves p27Kip1 activity in neuroblastoma

Dana-Lynn T Koomoa et al. Int J Oncol. 2013 Apr.

Abstract

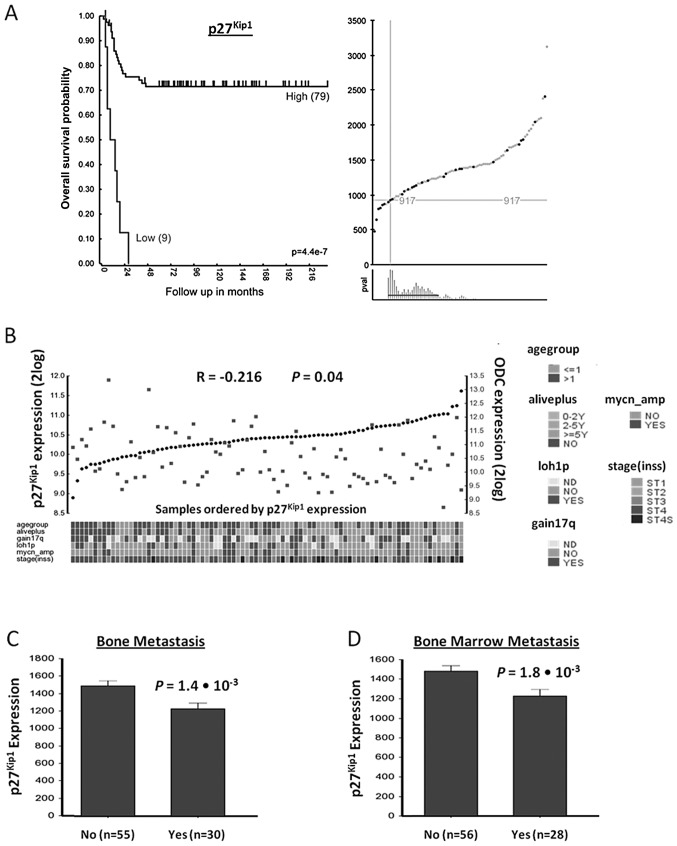
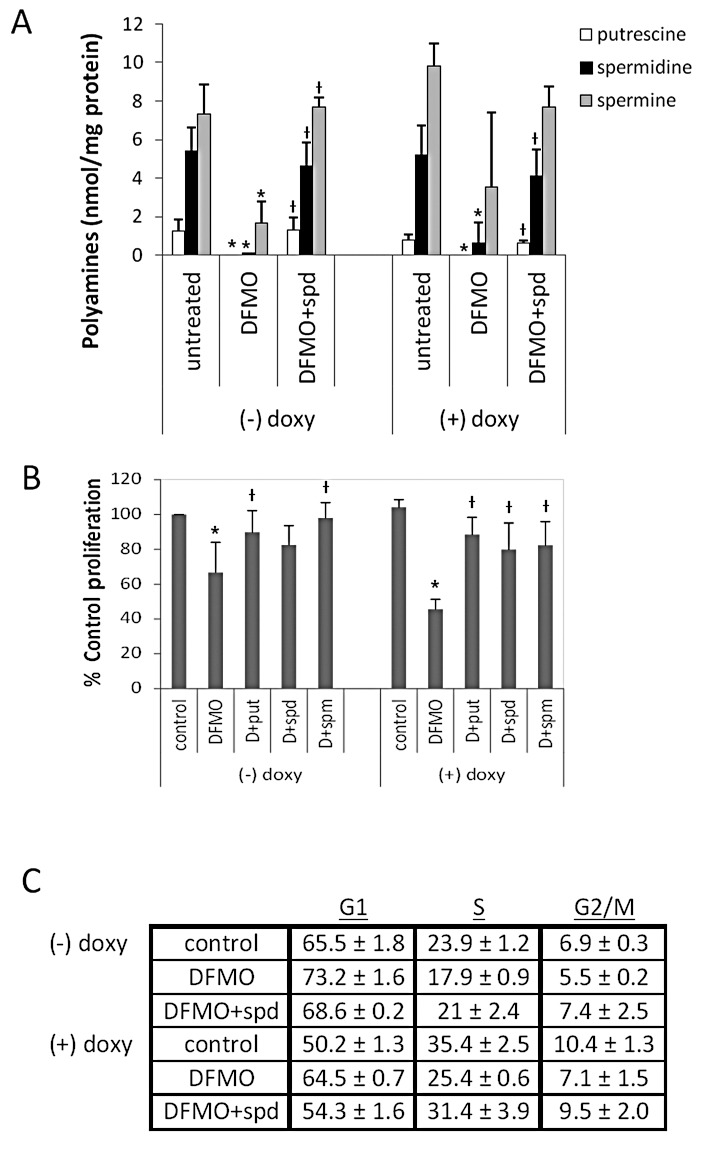
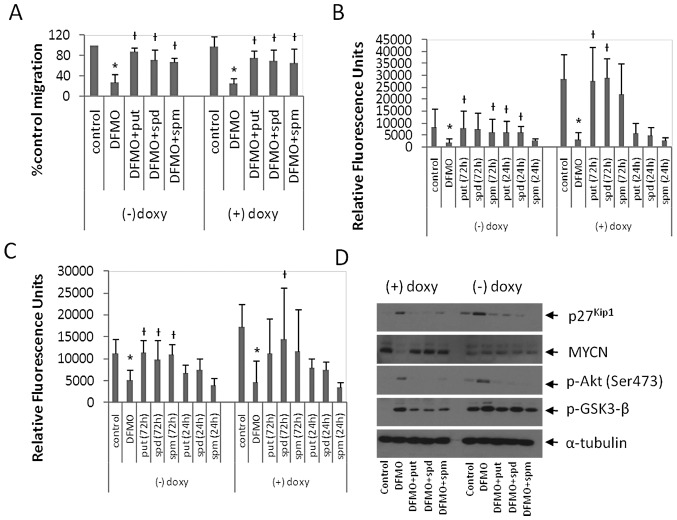
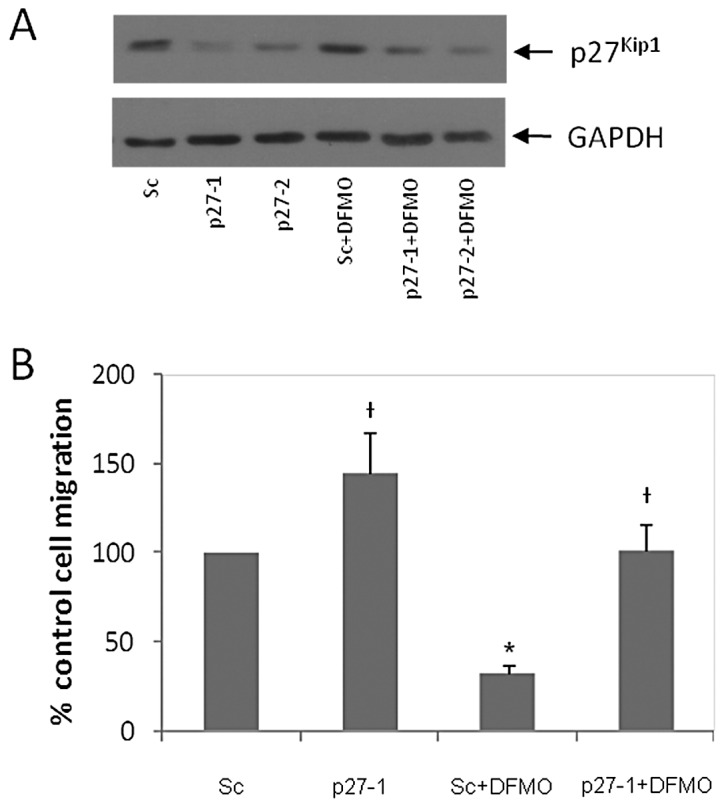
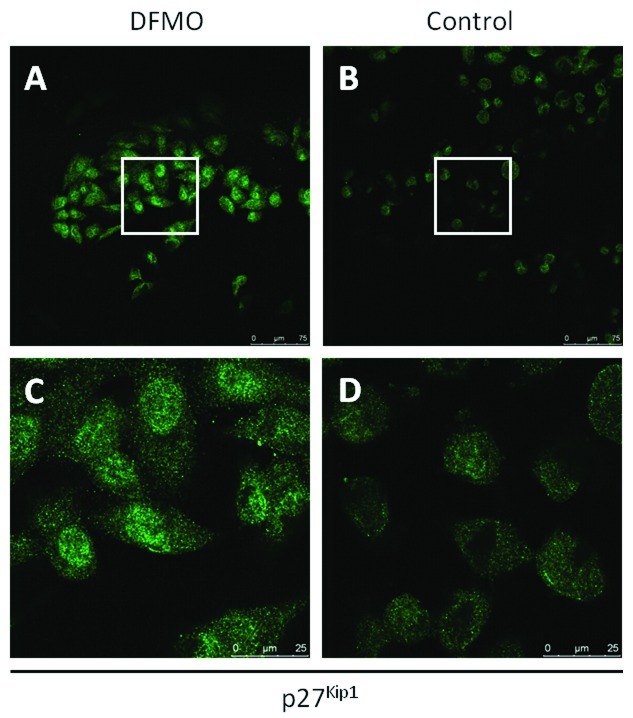
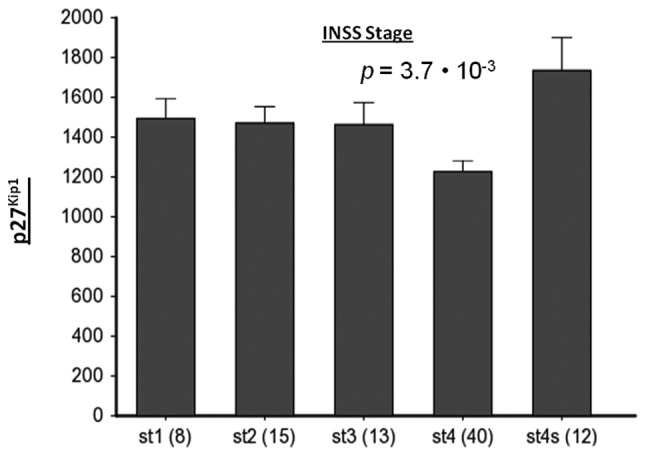
Neuroblastoma (NB) is the most common extracranial pediatric tumor. NB patients over 18 months of age at the time of diagnosis are often in the later stages of the disease, present with widespread dissemination, and often possess MYCN tumor gene amplification. MYCN is a transcription factor that regulates the expression of a number of genes including ornithine decarboxylase (ODC), a rate-limiting enzyme in the biosynthesis of polyamines. Inhibiting ODC in NB cells produces many deleterious effects including G(1) cell cycle arrest, inhibition of cell proliferation, and decreased tumor growth, making ODC a promising target for drug interference. DFMO treatment leads to the accumulation of the cyclin-dependent kinase inhibitor p27(Kip1) protein and causes p27(Kip1)/Rb-coupled G(1) cell cycle arrest in MYCN-amplified NB tumor cells through a process that involves p27(Kip1) phosphorylation at residues Ser10 and Thr198. While p27(Kip1) is well known for its role as a cyclin-dependent kinase inhibitor, recent studies have revealed a novel function of p27(Kip1) as a regulator of cell migration and invasion. In the present study we found that p27(Kip1) regulates the migration and invasion in NB and that these events are dependent on the state of phosphorylation of p27(Kip1). DFMO treatments induced MYCN protein downregulation and phosphorylation of Akt/PKB (Ser473) and GSK3-β (Ser9), and polyamine supplementation alleviated the DFMO-induced effects. Importantly, we provide strong evidence that p27(Kip1) mRNA correlates with clinical features and the survival probability of NB patients.


Figures

Figure 1
Figure 1
p27Kip1 gene expression correlation with patient prognosis, ODC expression, and metastasis in NB. (A) Correlation of p27Kip1 gene expression with NB patient survival prognosis. The Kaplan-Meier graph represents the survival prognosis of 88 NB patients based on high or low expression levels of p27Kip1 (A, left graph). The survival probability of NB patients (follow-up over 216 months) with low p27Kip1 expression is significantly lower than of patients with high p27Kip1 expression. For the Kaplan-Meier analysis, the P-values were calculated for all 72 groups tested. For p27Kip1, the 9 ‘low’ versus the 79 ‘high’ group represents the most significant P-value (P=4.4×10⁻⁷), but the P-value was <0.05 for all groups from 8 low/80 high to 30 low/58 high. Also when the 88 tumors were divided using the median or average p27Kip1 expression, the P-value was <0.05, showing that p27Kip1 expression has a robust correlation with survival as shown in the expression curves and P-value ranges for the Kaplan-Meier graph (A, right graphs). Upper graph, X-axis shows tumors ranked from left to right according to their p27Kip1 gene expression level, green dots and red dots represent tumors from patients that were still alive or were dead from disease at the time of this analysis, respectively. Y-axis shows Affymetrix p27Kip1 expression levels. Crosshairs mark the expression cut-off used for the grouping shown in the Kaplan-Meier curve. Lower graph, X-axis shows tumor groupings tested. Y-axis shows P-value of each grouping (with a P-value of 1 at the bottom). Red horizontal line represents the P<0.05 cut-off. Statistical analysis was performed with the log-rank test. (B) p27Kip1 and ODC expression correlation in NB tumors. Visual representation of p27Kip1 and ODC expression in all 88 NB tumors, ranked horizontally from left to right according to their p27Kip1 expression. p27Kip1 and ODC expression values for each tumor are visualized with black circles and red rectangles, respectively. The correlation between p27Kip1 and ODC expression is r = −0.216, with P=0.04 (2log Pearson). Below the graph is the clinical annotation of all 88 tumor samples, the annotation legend is to the right of the graph. (C and D) Correlation of p27Kip1 expression levels with NB metastasis. Bone and bone marrow metastasis are significant predictors of poor outcome in NB. (C) Correlation with bone metastasis. Children with NB metastasized to the bone (n=30) show significantly lower p27Kip1 tumor expression than infants without metastasis (55 samples; P=1.4×10⁻³, data available for 85 of 88 tumors). (D) Correlation with bone metastasis. Children with NB metastasized to the bone marrow (n=28) show significantly lower p27Kip1 tumor expression than infants without metastasis (56 samples; P=1.8×10⁻³, data available for 84 of 88 tumors). Statistical analysis of (C) and (D) was performed using the non-parametric Kruskal-Wallis tests, but for reasons of representation, the bar plots show actual expression values. For expression value calculations in all panels, see Materials and methods.
Figure 2
Figure 2
DFMO inhibits polyamine biosynthesis, cell proliferation, and induces G1 cell cycle arrest in tetracycline-inducible MYCN overexpressing NB cells (MYCN2). (A) Cells were treated with doxycycline ± 5 mM DFMO ± 10 μM spermidine or left untreated for 72 h, and intracellular polyamine levels were measured. DFMO treatment depleted intracellular polyamine levels, and supplemental spermidine in culture media reversed the effects of DFMO. (B) Cells were treated with doxycycline ± 5 mM DFMO ± 10 μM putrescine, 10 μM spermidine or 10 μM spermine, or left untreated for 72 h, and cell proliferation was measured using the MTS assay. DFMO significantly inhibited proliferation in NB cells with and without MYCN overexpression. Supplementing external media with polyamines reversed the effects of DFMO. Results of (A) and (B) are represented as mean ± SD, n=3. *Statistically significant difference between values obtained from DFMO-treated vs. untreated cells. Statistically significant difference between values obtained from DFMO-treated cells and cells treated with both DFMO and spermidine (P<0.05). (C) Cells were treated with doxycycline ± 5 mM DFMO ± 10 μM spermidine or left untreated for 72 h, and flow cytometry was performed with propidium iodide to quantify the percentage of cells in each phase of the cell cycle (G1, S, and G2/M). DFMO increased the percentage of cells in the G1 phase of the cell cycle, and supplementing external media with spermidine reversed the effects of DFMO. Results are represented as mean ± SD, n=3. Doxy, doxycyline; put, putrescine; spd, spermidine; spm, spermine.
Figure 3
Figure 3
DFMO inhibits cell migration and invasion, increases p27Kip1 expression, and increases the phosphorylation of Akt (Ser473) and GSK3-β (Ser9). (A) MYCN2 cells were treated with or without doxycycline and 5 mM DFMO ± 10 μM putrescine, 10 μM spermidine or 10 μM spermine for 72 h and the wound healing assay was performed. DFMO inhibited cell migration. Supplementing the external media with putrescine, spermidine or spermine reversed the effects of DFMO. Results are represented as mean ± SD, n=3. (B and C) MYCN2 cells were treated with doxycycline ± 5 mM DFMO. The external medium was supplemented with ± 10 μM putrescine, 10 μM spermidine or 10 μM spermine or left untreated for 72 h of DFMO treatment or the last 24 h of DFMO treatment. Transwell migration (B) and invasion (C) assays were performed. DFMO inhibited NB migration and invasion. Supplementing external media with polyamines for 72 h of DFMO treatment reversed the effects of DFMO. Supplementing external media with polyamines for the last 24 h of DFMO treatment only partially reversed the effects of DFMO. (A–C) Results are represented as mean ± SD, n=3 in duplicates. *Statistically significant difference between values obtained from DFMO-treated vs. untreated cells. Statistically significant difference between values obtained from DFMO-treated cells and cells treated with both DFMO and putrescine, spermidine or spermine (P<0.05). (D) MYCN2 cells were treated with or without doxycycline and 5 mM DFMO ± 10 μM putrescine, 10 μM spermidine or 10 μM spermine for 72 h. DFMO treatment induced p27Kip1 accumulation, downregulation of MYCN expression, and increased the phosphorylation of Akt (Ser473) and GSK3-β (Ser9). Tubulin was used as a loading control. Analysis was performed in three independent experiments (n=3). Doxy, doxycyline; put, putrescine; spd, spermidine; spm, spermine.
Figure 4
Figure 4
Downregulation of p27Kip1 increased NB migration. NB cells were transfected with siRNA specific for p27Kip1 or scrambled (Sc) sequence. p27-1 represents transfection of cells with 40 pmol siRNA and p27-2 represents 80 pmol siRNA. Control cells were transfected with 80 pmol scrambled siRNA. (A) Whole cell lysates were analyzed by western blotting for p27Kip1 expression. GAPDH was used as a loading control. (B) Wound healing assays. Untreated and DFMO-treated cells transfected with p27Kip1 siRNA had a higher migration rate than cells transfected with scrambled siRNA. *Statistically significant difference between values obtained from DFMO-treated vs. untreated cells, transfected with scrambled siRNA. Statistically significant difference between values obtained from DFMO-treated cells transfected with scrambled siRNA and DFMO-treated and untreated cells transfected with p27Kip1 siRNA (P<0.05). Data are represented as mean ± SD (n=2).
Figure 5
Figure 5
DFMO treatment induces p27Kip1 accumulation in the nucleus and cytoplasm. DFMO-treated cells (A) and untreated cells (B) were fixed and immunostained fluorescently for p27Kip and analyzed by confocal microscopy. The white squares in the lower power images (A and B) are magnified below (C and D). Data are representative of three independent experiments (n=3).
Figure 6
Figure 6
Stage 4 NB has significantly lower p27Kip1 mRNA expression than other NB stages. The results shown are for the NB88 set described in this study, the P-value is for a Kruskal-Wallis t-test. In addition, significantly lower p27Kip1 expression in stage 4 NB than in other NB stages was found in the Jagannathan-100 (P=7.1×10⁻³) and Oberthuer-251 (P=9.3×10⁻⁵) series in the public domain. For data set details and analyses see Materials and methods.

References

    1. Maris JM, Hogarty MD, Bagatell R, Cohn SL. Neuroblastoma. Lancet. 2007;369:2106–2120. - PubMed
    1. Maris JM. Recent advances in neuroblastoma. N Engl J Med. 2010;362:2202–2211. - PMC - PubMed
    1. Schwab M, Westermann F, Hero B, Berthold F. Neuroblastoma: biology and molecular and chromosomal pathology. Lancet Oncol. 2003;4:472–480. - PubMed
    1. Brodeur GM. Neuroblastoma: biological insights into a clinical enigma. Nat Rev Cancer. 2003;3:203–216. - PubMed
    1. Canete A, Gerrard M, Rubie H, et al. Poor survival for infants with MYCN-amplified metastatic neuroblastoma despite intensified treatment: the International Society of Paediatric Oncology European Neuroblastoma Experience. J Clin Oncol. 2009;27:1014–1019. - PubMed

Publication types

MeSH terms