. 2013 Apr 1;190(7):3216-24.
doi: 10.4049/jimmunol.1202926. Epub 2013 Feb 25.

KIR3DL2 binds to HLA-B27 dimers and free H chains more strongly than other HLA class I and promotes the expansion of T cells in ankylosing spondylitis

Affiliations

KIR3DL2 binds to HLA-B27 dimers and free H chains more strongly than other HLA class I and promotes the expansion of T cells in ankylosing spondylitis

Isabel Wong-Baeza et al. J Immunol. .

Abstract

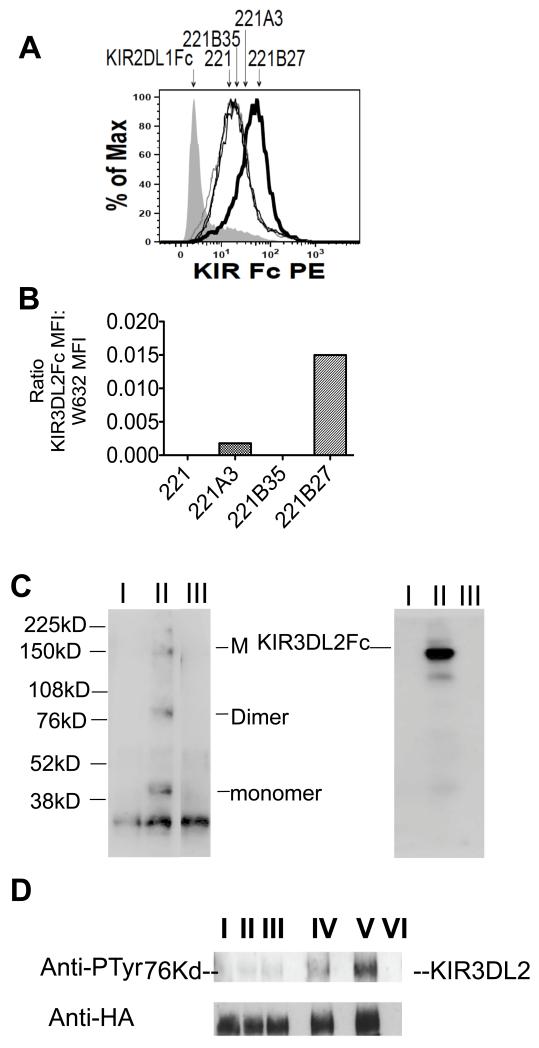
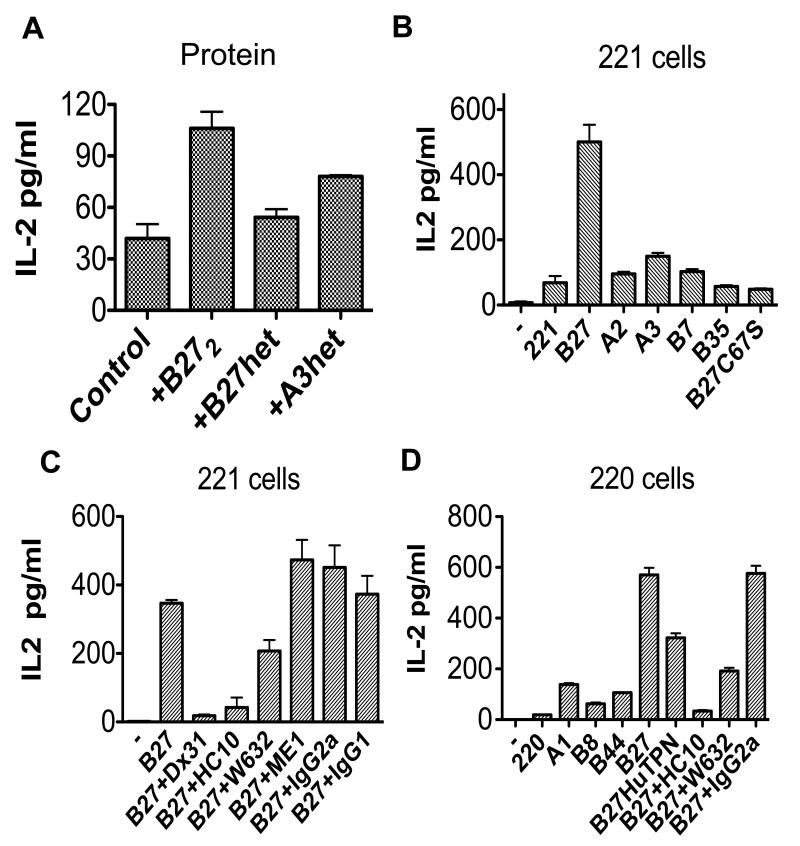
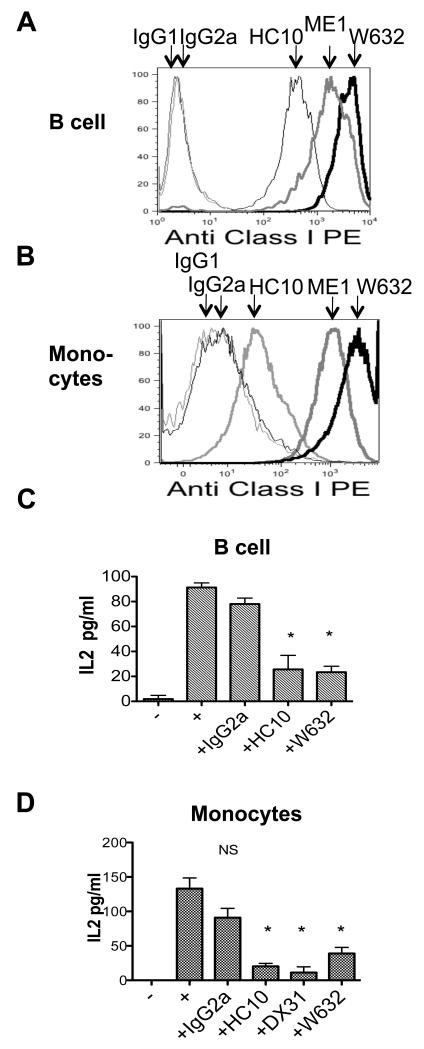
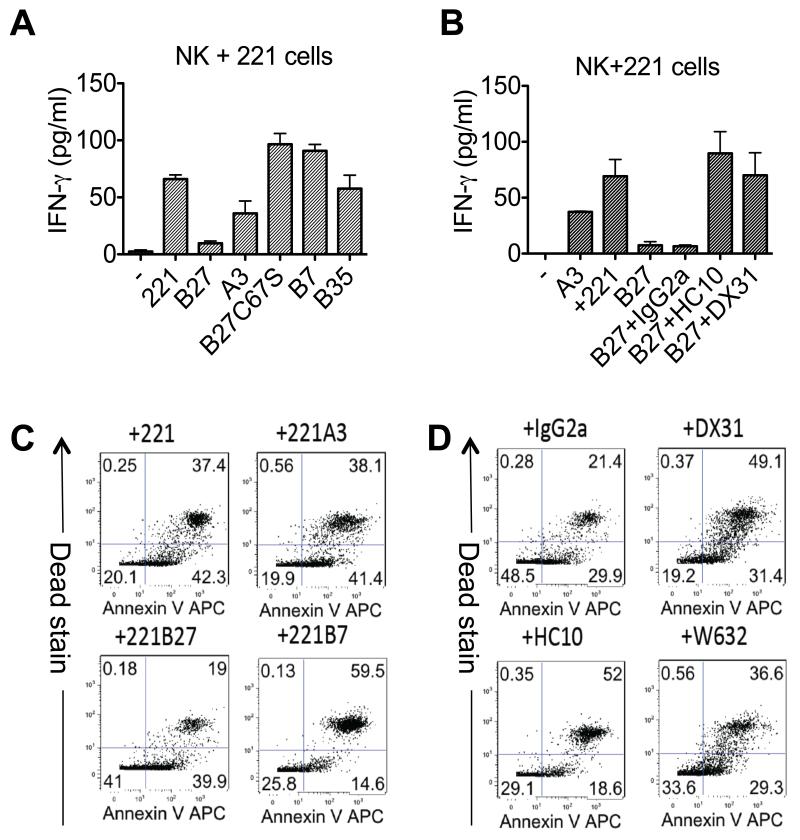
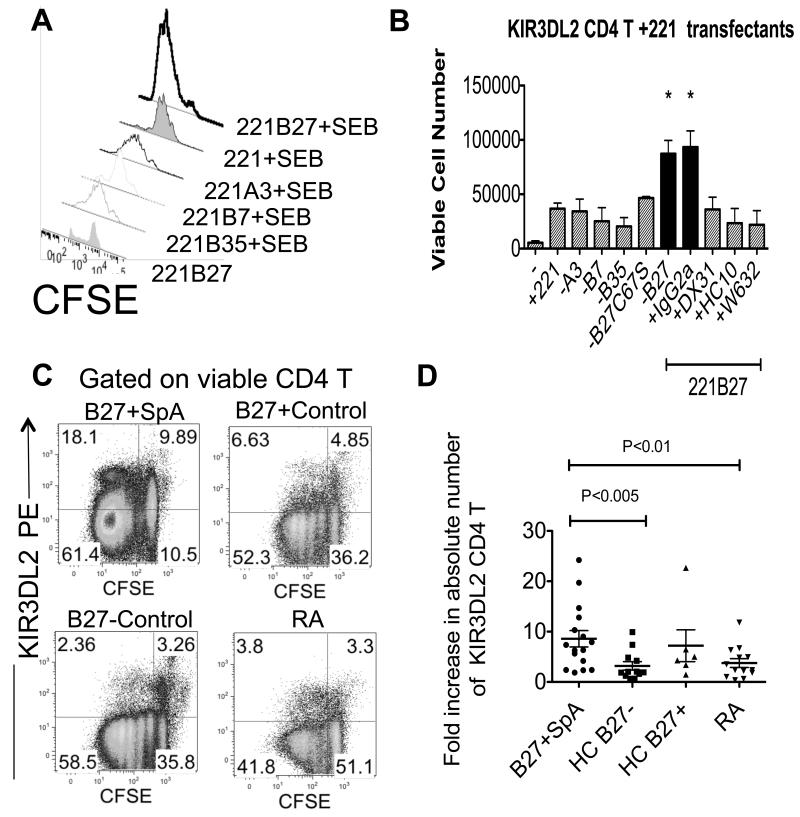
The human leukocyte Ag HLA-B27 (B27) is strongly associated with the spondyloarthritides. B27 can be expressed at the cell surface of APC as both classical β2-microglobulin-associated B27 and B27 free H chain forms (FHC), including disulfide-bonded H chain homodimers (termed B27(2)). B27 FHC forms, but not classical B27, bind to KIR3DL2. HLA-A3, which is not associated with spondyloarthritis (SpA), is also a ligand for KIR3DL2. In this study, we show that B27(2) and B27 FHC bind more strongly to KIR3DL2 than other HLA-class I, including HLA-A3. B27(2) tetramers bound KIR3DL2-transfected cells more strongly than HLA-A3. KIR3DL2Fc bound to HLA-B27-transfected cells more strongly than to cells transfected with other HLA-class I. KIR3DL2Fc pulled down multimeric, dimeric, and monomeric FHC from HLA-B27-expressing cell lines. Binding to B27(2) and B27 FHC stimulated greater KIR3DL2 phosphorylation than HLA-A3. B27(2) and B27 FHC stimulated KIR3DL2CD3ε-transduced T cell IL-2 production to a greater extent than control HLA-class I. KIR3DL2 binding to B27 inhibited NK IFN-γ secretion and promoted greater survival of KIR3DL2(+) CD4 T and NK cells than binding to other HLA-class I. KIR3DL2(+) T cells from B27(+) SpA patients proliferated more in response to Ag presented by syngeneic APC than the same T cell subset from healthy and disease controls. Our results suggest that expansion of KIR3DL2-expressing leukocytes observed in B27(+) SpA may be explained by the stronger interaction of KIR3DL2 with B27 FHC.


Figures

Figure 1
Figure 1. B272 protein and tetramers bind to KIR3DL2-transfected cells more strongly than HLA-A3
A. Representative FACS stain of KIR3DL2 transfected Baf3 cells with saturating concentrations of B27 dimer and HLA-A3 tetramers. Geometric MFIs for staining were 206 and 52 for B27 dimer and HLA-A3 tetramer staining respectively. Representative of one of four independent experiments. B. Titration of phycoerythrin (PE)-labelled B272 and HLA-A3 tetramer in FACS staining of KIR3DL2 transfected Baf3 cells. Representative stain from one of four independent experiments. C. FACs staining of KIR3DL2 Baf3 cells with B27 dimer (B272) HLA-A3, HLA-B8 and HLA-B27 protein. Representative staining of one of three independent experiments. D. B272 tetramers compete for binding to KIR3DL2 more strongly than HLA-A3. Left hand top panel. B272 tetramer competition with PE-labelled HLA-A3 tetramer bound to KIR3DL2 Baf3 cells. Staining with HLA-A3 tetramer at 0, 30 and 60 minutes after addition of HLA-A3 or B272 tetramer. Left hand bottom panel. HLA-A3 tetramer competition with PE-labelled B272 tetramer bound to KIR3DL2 Baf3 cells. Staining with B272 tetramer at 0, 30 and 60 minutes after addition of HLA-A3 or B272 tetramer. Results are presented as the mean reduction in the geometric MFI of tetramer staining from three independent experiments ± 1SD.
Figure 2
Figure 2. KIR3DL2Fc binds B272 more strongly than other HLA class I
A. FACS staining of non-transfected LBL.721.221 (221) cells and 221 cells transfected with HLA-B27, HLA-A3 and HLA-B35 with KIR3DL2Fc. 221B27 cells stained with control DR5Fc fusion proteins is also shown. Geometric MFIs for staining of 221, 221B27, 221A3 and 221B35 were 18, 46, 22 and 17 respectively. Representative FACS stain from one of three independent experiments. B. Ratio of KIR3DL2Fc MFI:W632 MFI for staining of 221 transfectants. Ratios were calculated after subtracting the MFI for KIR3DL2Fc staining of parental 221 cells. Ratios were calculated from the mean MFIs from three independent experiments. C. Non-reducing SDS-PAGE gel and western blot with HC10 of precipitated proteins from 221B27 cells with control DR5Fc, lane I, and with KIR3DL2Fc from 221B27, lane II, and 221B35 transfected cells, lane III (left hand panel). Positions of multimeric, M, B27 dimer, B272, and monomeric B27 heavy chains, B27, are indicated. The right panel shows the same blot reprobed with HRP-conjugated anti-human Igs. The position of KIR3DL2Fc is indicated. Representative western blots from one of three independent experiments. D. Upper panel. Phosphotyrosine western blots of immunoprecipitates of KIR3DL2-transduced Jurkat T cells (lane I), or T cells stimulated with superantigen and parental 221 cells (lane II) or HLA-B35 (lane III), -A3 (lane IV), or -B27 transfectants (lane V). Lane VI: 221B27 cells alone. Lower panel. Western blot reprobed with anti-HA. Representative blots from one of three independent experiments.
Figure 3
Figure 3. B27 dimers and free heavy chains stimulate KIR3DL2CD3ε reporter T cells more strongly than control HLA class I
A. IL-2 production by KIR3DL2CD3ε–transduced T cells stimulated with recombinant HLA-B27 dimer and -B27 or HLA-A3 heterotrimers. Results, presented as mean values from triplicate samples (pg/ml)±1SD. B IL-2 secretion by KIR3DL2CD3ε–transduced Jurkat T cells, stimulated with parental LBL.721.221 (221) cells and cells transfected with HLA-B27, HLA-B27C67S, HLA-B7, HLA-B35, HLA-A2 and HLA-A3. Results presented as mean values from 5 independent experiments (pg/ml) ± 1SEM. C. IL-2 production by KIR3DL2CD3ε–transduced T cells stimulated with 221B27 cells with HC10, W632, ME1 and IgG2a and IgG1 isotype control MAbs or the anti-KIR3DL2 MAb (DX31). Results presented as mean values from triplicate samples (pg/ml) ± 1SD are representative of 4 independent experiments. D. IL-2 production by KIR3DL2CD3ε transduced T cells stimulated with parental LBL.221.220 cells, 220B8, 220B27 cells with HC10, W632, ME1 and IgG2a and IgG1 isotype control MAbs and 220B27 cells transfected with human tapasin (HuTPN). Results presented as mean values from triplicate samples (pg/ml) ± 1SD are representative of 4 independent experiments.
Figure 4
Figure 4. B cell lines and monocytes from B27+SpA patients and B27+controls express HLA-class I ligands for KIR3DL2
A Representative FACS stain with W632, HC10 and ME1 antibodies of an EBV transformed B cell line from a B27+SpA patient. Representative stain from one of four different B cell lines. Geometric MFIs for staining with HC10, ME1 and W632 were 406, 1443 and 3464 respectively. B Representative FACS stain with HC10 and ME1 antibodies of CD14+ monocytes from a B27+SpA patient. Representative stain from one of four monocyte samples. Geometric MFIs for staining with HC10, ME1 and W632 were 82, 1315 and 2724 respectively. C IL-2 production by KIR3DL2CD3ε reporter cells stimulated with primary B cell lines and D primary monocyte lines from a B27+ healthy control and a B27+ AS patient. IL-2 production by reporter cells is inhibited by anti-heavy chain (HC10), -KIR3DL2 and W632 monoclonals. Representative data from experiments with 4 different B cell lines and 3 monocyte lines. Results with B cell lines were repeated on 3 independent occasions. Results are expressed as mean values of IL-2 pg/ml +/− 1SD. * values P<0.05 by ANOVA.
Figure 5
Figure 5. KIR3DL2 ligation by HLA-B27 inhibits NK cell IFNγ and promotes NK cell survival
A. IFNγ production by KIR3DL2-expressing NK cells stimulated with parental 221 cells and 221 cells transfected with HLA-B27, -A3,-B7, -B35 or -B27C67S. Representative data from triplicate samples from one of three independent experiments. B IFNγ production by KIR3DL2-expressing NK cells stimulated with parental 221B27 cells and anti-KIR3DL2 (DX31), anti HLA-class I heavy chain (HC10) or isotype control MAbs (IgG2a). Representative data from triplicate samples from one of three independent experiments. C. Annexin V and live-dead (Dead) staining of KIR3DL2+NK cells stimulated for 7 days with parental 221 cells or 221A3, -B27 or B7 cells. Representative data from one of three independent experiments. Lower left hand quadrants indicate percentages of viable NK cells remaining at the end of the assay. D. Annexin V and live-dead staining of KIR3DL2+NK cells stimulated for 7 days with 221B27 cells and anti-KIR3DL2 (DX31), anti-HLA-class I MAbs (HC10 and W632) or isotype control MAb.
Figure 6
Figure 6. Enhanced survival of KIR3DL2-expressing T cells stimulated with 221B27 cells. Increased expansion of antigen stimulated KIR3DL2+ CD4 T cells in B27+SpA patients
A. Viable CFSE-labelled primary KIR3DL2+CD4 T cells after stimulation with parental 221 cells and 221B27,-B7,-B35 and −A3 and superantigen (SEB) or with 221B27 cells without superantigen. Geometric MFIs are 439 (221B27+SEB), 998(221+SEB), 851 (221A3+SEB), 1214 (221B7+SEB), 1935 (221B35+SEB) and 2876 (221B27). Representative FACS stain from one of five independent experiments. B. Numbers of viable CFSE-labelled primary KIR3DL2+CD4 T cells after 5 day stimulation with 221B27 cells without stimulus (−) or parental 221 cells, 221-A3, -B7, -B35, -B27C67S and -B27 cells with SEB. Numbers of viable CD4 T cells after 5 day stimulation with SEB and 221B27 cells with control (IgG2a), anti-HLA-class I(HC10 or W632) or anti-KIR3DL2 (DX31) MAbs are also shown. Mean data ±1SEM from three independent experiments. Values with an asterisk* indicate P<0.05 by ANOVA for T cells stimulated with SEB and 221B27 or SEB 221B27 and isotype MAb (IgG2a) compared to other stimuli. NS=not significant. C. Representative FACS stains of CFSE-labelled PBMC from an AS and RA patient and a healthy B27-control and healthy B27+ control showing proliferation of KIR3DL2+ and KIR3DL2-CD4 T cells following 5 day stimulation with superantigen (SEB). Representative FACS stains from 10 independent experiments. D. Fold increase in peripheral blood KIR3DL2 CD4 T cells from AS patients, B27− and B27+ healthy controls and RA patients following 5 day stimulation with SEB. Right hand panel. Mean fold increases in absolute KIR3DL2+CD4 T cell numbers with interquartile ranges for each of the groups studies are 8.6 and 9.3 (n=16) for B27+SpA, 3.2 and 3.4 for B27−HC (n=12), 7.2 and 9 for B27+HC (n=6), and 3.8 and 4.2 for RA patients (n=13).

References

    1. Brown MA, Pile KD, Kennedy LG, Calin A, Darke C, Bell J, Wordsworth BP, Cornelis F. HLA class I associations of ankylosing spondylitis in the white population in the United Kingdom. Ann Rheum Dis. 1996;55:268–270. - PMC - PubMed
    1. Colbert RA, DeLay ML, Layh-Schmitt G, Sowders DP. HLA-B27 misfolding and spondyloarthropathies. Adv Exp Med Biol. 2009;649:217–234. - PubMed
    1. Fiorillo MT, Sorrentino R. T-cell responses against viral and self-epitopes and HLA-B27 subtypes differentially associated with ankylosing spondylitis. Adv Exp Med Biol. 2009;649:255–262. - PubMed
    1. Lopez de Castro JA. HLA-B27 and the pathogenesis of spondyloarthropathies. Immunol Lett. 2007;108:27–33. - PubMed
    1. Kollnberger S, Bird L, Sun MY, Retiere C, Braud VM, McMichael A, Bowness P. Cell-surface expression and immune receptor recognition of HLA-B27 homodimers. Arthritis Rheum. 2002;46:2972–2982. - PubMed

Publication types

MeSH terms