. 2011 Oct;221(1-4):145-157.
doi: 10.1007/s11270-011-0777-x.

Metal and Metalloid Contaminants in Atmospheric Aerosols from Mining Operations

Affiliations

Metal and Metalloid Contaminants in Atmospheric Aerosols from Mining Operations

Janae Csavina et al. Water Air Soil Pollut. 2011 Oct.

Abstract

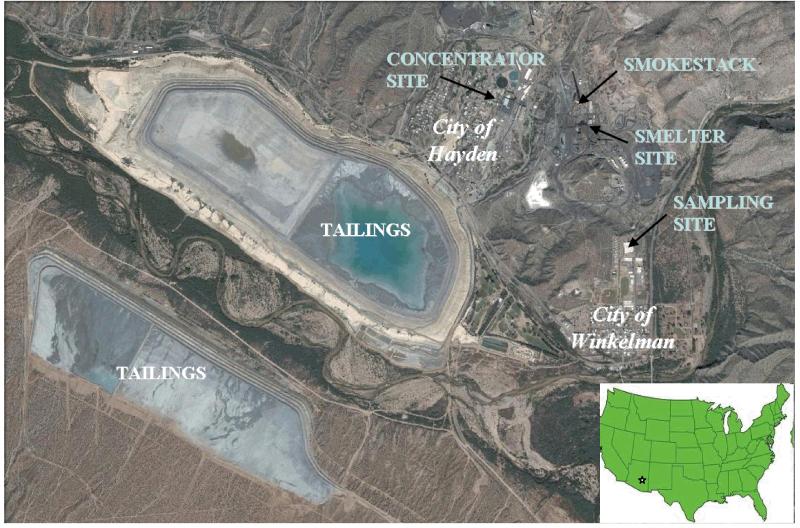
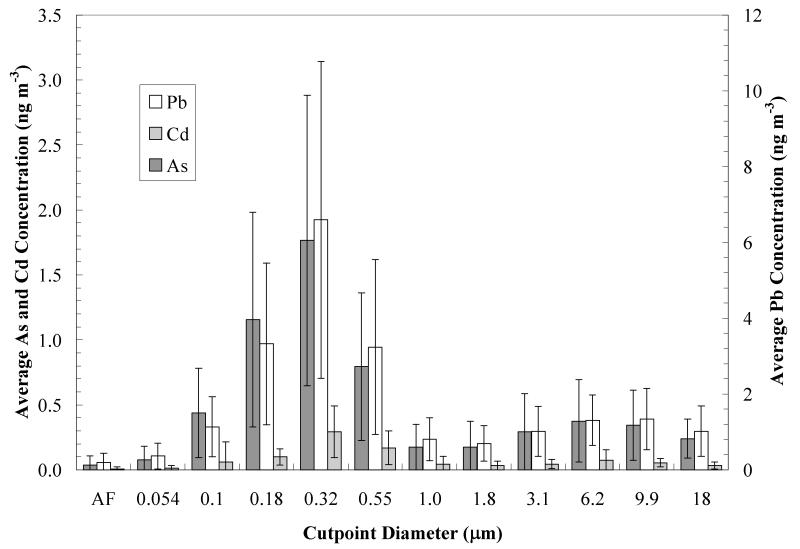
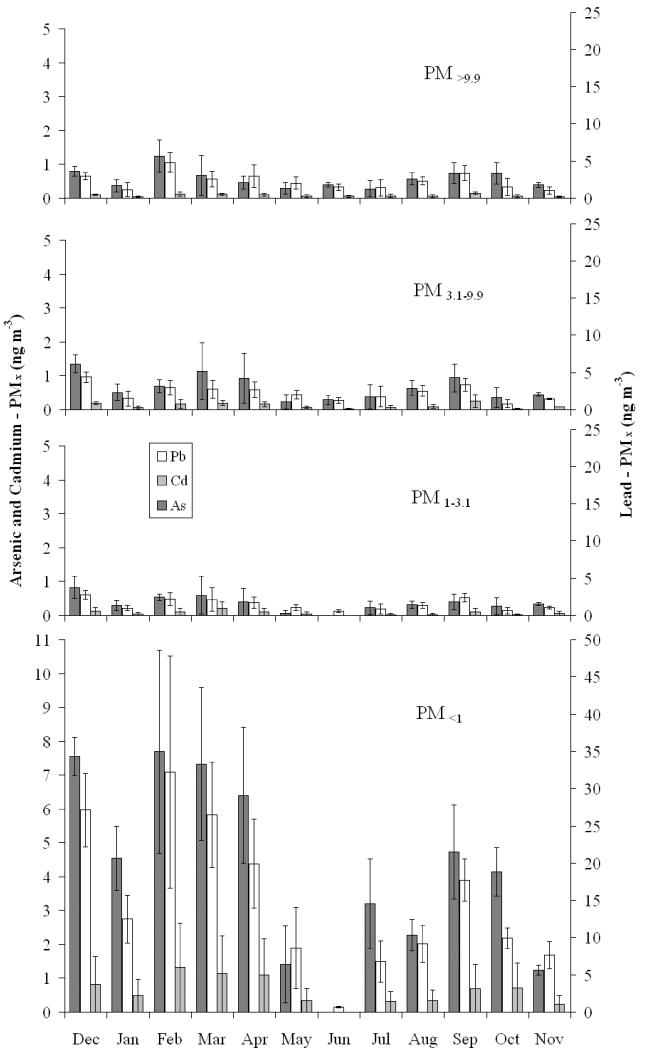
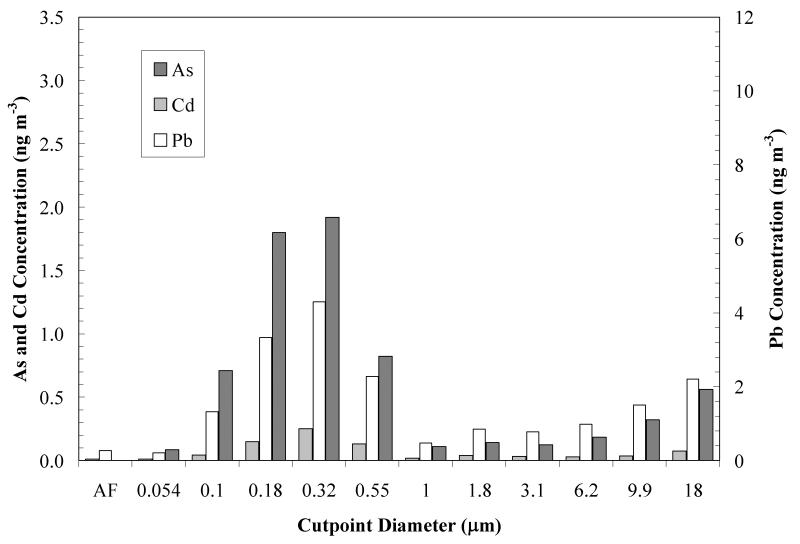
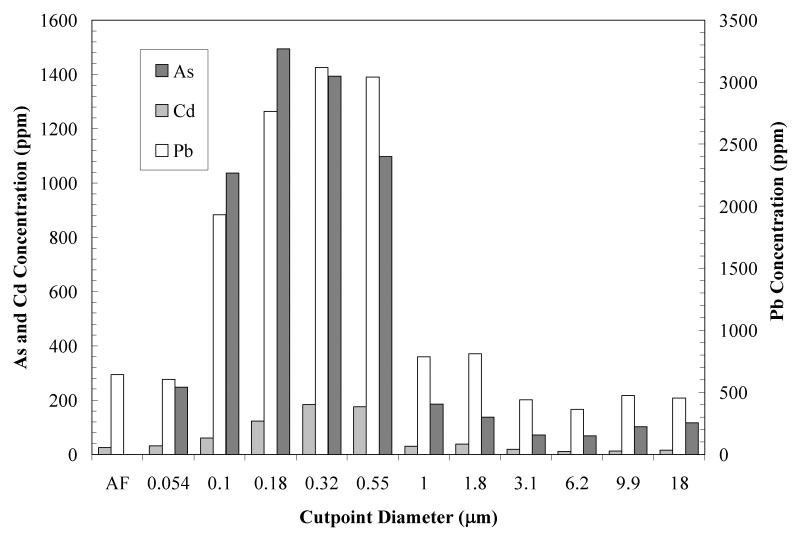
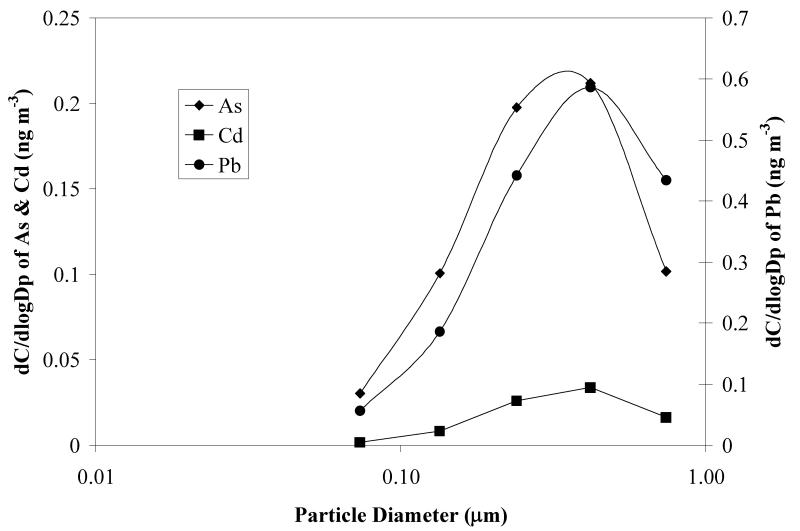
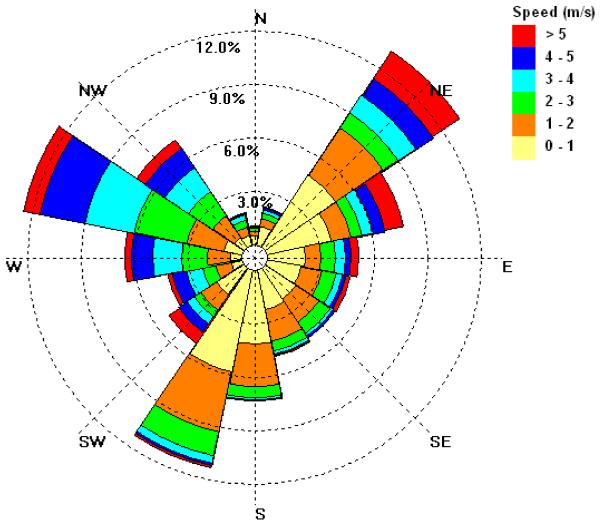
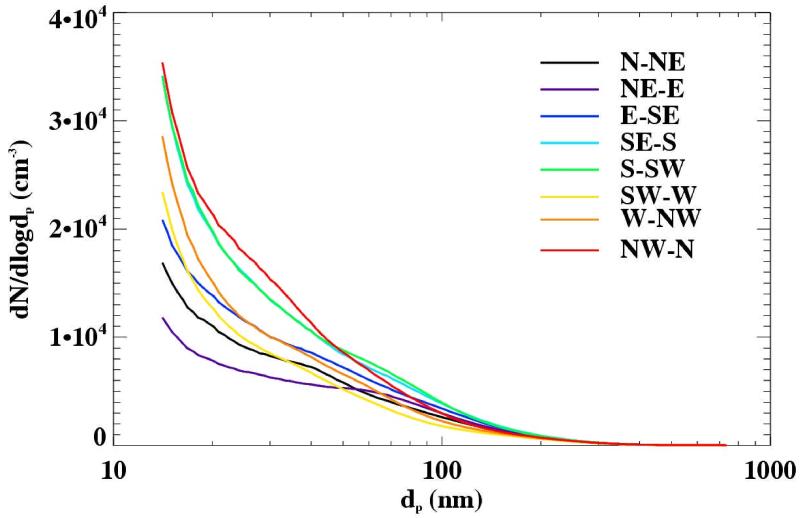
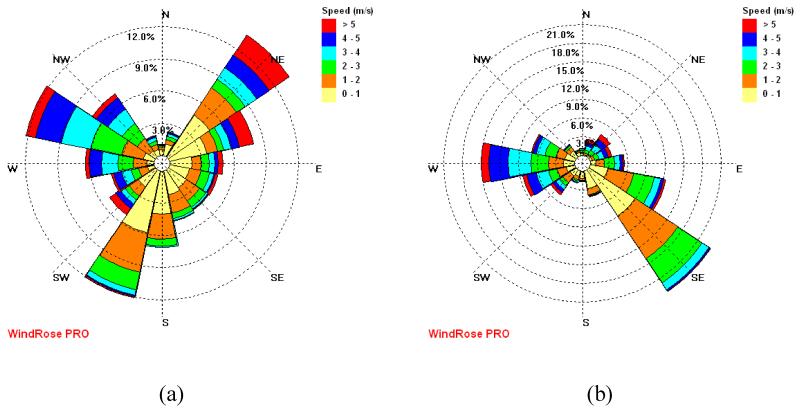
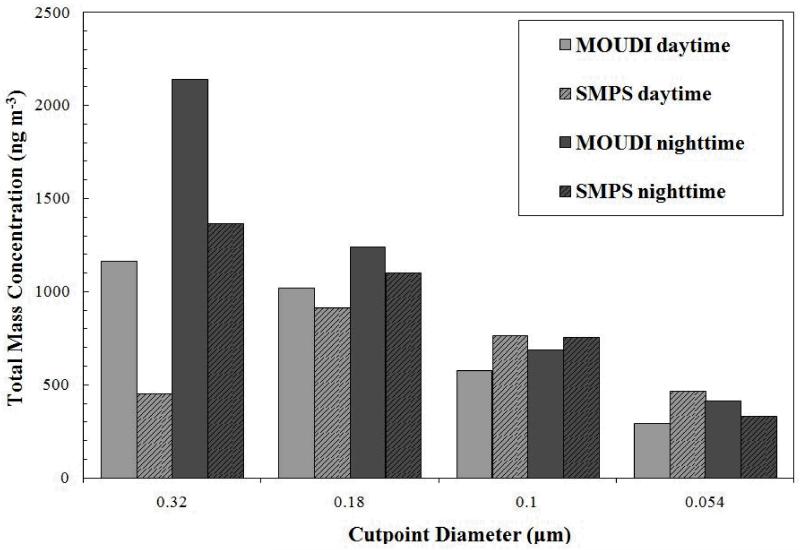
Mining operations are potential sources of airborne metal and metalloid contaminants through both direct smelter emissions and wind erosion of mine tailings. The warmer, drier conditions predicted for the Southwestern US by climate models may make contaminated atmospheric dust and aerosols increasingly important, with potential deleterious effects on human health and ecology. Fine particulates such as those resulting from smelting operations may disperse more readily into the environment than coarser tailings dust. Fine particles also penetrate more deeply into the human respiratory system, and may become more bioavailable due to their high specific surface area. In this work, we report the size-fractionated chemical characterization of atmospheric aerosols sampled over a period of a year near an active mining and smelting site in Arizona. Aerosols were characterized with a 10-stage (0.054 to 18 μm aerodynamic diameter) multiple orifice uniform deposit impactor (MOUDI), a scanning mobility particle sizer (SMPS), and a total suspended particulate (TSP) collector. The MOUDI results show that arsenic and lead concentrations follow a bimodal distribution, with maxima centered at approximately 0.3 and 7.0 μm diameter. We hypothesize that the sub-micron arsenic and lead are the product of condensation and coagulation of smelting vapors. In the coarse size, contaminants are thought to originate as aeolian dust from mine tailings and other sources. Observation of ultrafine particle number concentration (SMPS) show the highest readings when the wind comes from the general direction of the smelting operations site.

Keywords: Aerosol; MOUDI; Metal Contaminants; Metalloid Contaminants; Mining Operations; SMPS.


Figures

Figure 1
Figure 1
Satelite map of Hayden-Winkelman, Arizona, with locations of mining and sampling operations. Top of the map is North and size of map is approximately 4.3 km by 6.6 km. The smokestack is 305 m tall. Terrain topography around the shown area is complex: elevation increases towards the North with a narrow valley extending in the NW-SE direction. Source: Google Maps.
Figure 2
Figure 2
Comparisons of As, Cd and Pb content in atmospheric air (TSP samples). Values are averages over ten 24-hour sampling periods at various sites in Southeast Arizona from July to December 2009. Error bars represent standard deviations over the ten sampling periods.
Figure 3
Figure 3
Annual averaged lead, arsenic and cadmium concentrations from MOUDI observations at the Hayden site for the period December 2008 through November 2009. Data represent average concentrations over thirty six 96-hour sampling periods; AF denotes after filter sample.
Figure 4
Figure 4
Comparisons of metal and metalloid content of MOUDI samples with PM10 data from EPA, and TSP observations at the Hayden site. Samples were taken between December 2008 and November 2009 for 36 and 55 sampling periods for the MOUDI and PM10 monitor, respectively. The TSP concentrations were averaged for 18 sampling periods spanning July 2009 to March 2010. Sampling periods may not have occurred on the exact same days. For MOUDI samples, PM9.9 represents the average of the summed mass concentrations in the corresponding size range, and TSP represents the average total concentration.
Figure 5
Figure 5
Monthly averages of arsenic, cadmium, and lead PMx measured with the MOUDI sampler at the Hayden site from December 2008 to November 2009. The size ranges are defined as follows: PM<9.9 is the summation of cutpoint diameters 9.9 and 18 μm, PM3.1-9.9 is the summation of cutpoint diameters 3.1 and 6.1μm, PM1-3.1 is the summation of cutpoint diameters 1 and 1.8μm, and PM<1 is the summation of cutpoint diameters lower than 1μm.
Figure 6
Figure 6
Lead, arsenic and cadmium concentrations from MOUDI observations at the Hayden site for a single 96-hour sampling period starting on October 14, 2009.
Figure 7
Figure 7
Solids concentrations of lead, arsenic and cadmium in MOUDI samples taken at the Hayden site for a 96-hour sampling period starting on October 14, 2009. These concentrations were obtained by dividing the concentrations in Figure 5 for each particle size range by the total mass of particles per unit air volume in the same size range.
Figure 8
Figure 8
Log-normal plot of lead, arsenic and cadmium concentrations for particle diameters <1 μm in MOUDI samples taken at the Hayden site for a 96-hour sampling period starting on October 14, 2009 (Figure 6). From these results, the calculated mean diameter is 0.17 μm and the geometric standard deviation is 2.68.
Figure 9
Figure 9
Wind rose obtained from the weather station co-located with the MOUDI sampler for the 96-hour sampling period starting on October 14, 2009 (corresponding to data in Figures 6 to 8). The results show a relatively high frequency of high wind speeds (> 3 m/s) from the WNW direction, which corresponds with the orientation of the mine tailings with respect to the sampler.
Figure 10
Figure 10
Scanning Electron Microscope images from MOUDI stages with cutpoint particle diameter of (a) 0.32 μm, particle depicted was identified to contain 21.19± 4.45 % Pb by weight by Electron Dispersive Spectroscopy; and (b) 6.1 μm.
Figure 11
Figure 11
Average SMPS size distribution over one MOUDI measurement period (March 17 through May 20, 2009) compared to an average (February 25 through March 13, 2009) from the city of Tucson.
Figure 12
Figure 12
A full day of size distribution data (SMPS measurements for April 18, 2009). Note the relatively high concentrations of 14 – 50 nm particles, starting at 1 pm.
Figure 13
Figure 13
Aerosol number size distributions as a function of wind direction for the measurement period March 17 through May 20, 2009.
Figure 14
Figure 14
Wind roses from two weather stations located within two miles of each other for December 2008 through November 2009: (a) Winkelman, where the MOUDI is located, and (b) Hayden, where the smelter is located. Differences show the complex terrain’s effect on wind patterns.
Figure 15
Figure 15
Estimate of mass concentrations from and SMPS volume distributions assuming a density of 1.5 g/cm3 and using MOUDI gravimetric analysis.

References

    1. Allen AG, Nemitz E, Shi JP, Harrison RM, Greenwood JC. Size distributions of trace metals in atmospheric aerosols in the United Kingdom. Atmospheric Environment. 2001;35:4581–4591.
    1. Alloway BJ, Ayres DC. Chemical Principles of Environmental Pollution. Blackie Academic & Professional; New York: 1997.
    1. Baker EL, Hayes CG, Landrigan PJ, Handke JL, Leger RT, Housworth WJ, Harrington JM. A nationwide survey of heavy metal absorption in children living near primary copper, lead, and zinc smelters. American Journal of Epidemiology. 1977;106:261–273. - PubMed
    1. Banic C, Leaitch WR, Strawbridge K, Tanabe R, Wong H, Gariépy C, Simonetti A, Nejedly Z, Campbell JL, Lu J, Skeaff J, Paktunc D, MacPherson JI, Daggupaty S, Geonac’h H, Chatt A, Lamoureux M. The physical and chemical evolution of aerosols in smelter and power plant plumes: an airborne study. Geochemistry: Exploration, Environment, Analysis. 2006;6:111–120.
    1. Barbaris B, Betterton EA. Initial snow chemistry survey of the Mogollon Rim in Arizona. Atmospheric Environment. 1996;30:3093–3103.

LinkOut - more resources