

High-resolution mutational profiling suggests the genetic validity of glioblastoma patient-derived pre-clinical models
- PMID: 23441165
- PMCID: PMC3575368
- DOI: 10.1371/journal.pone.0056185
High-resolution mutational profiling suggests the genetic validity of glioblastoma patient-derived pre-clinical models
Abstract
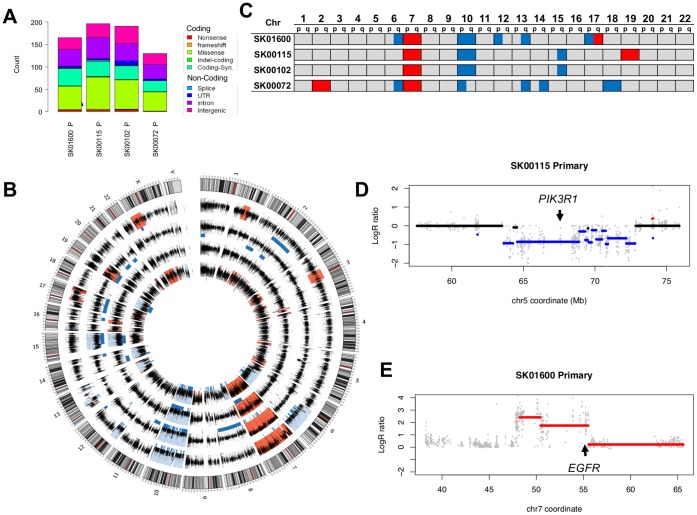
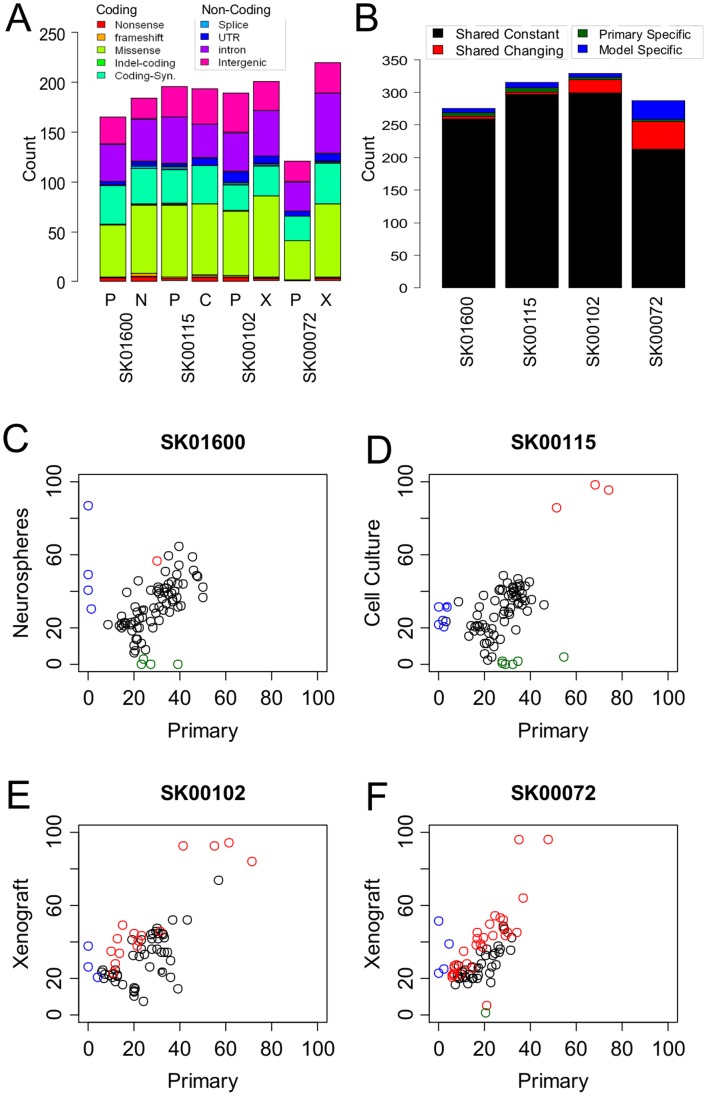
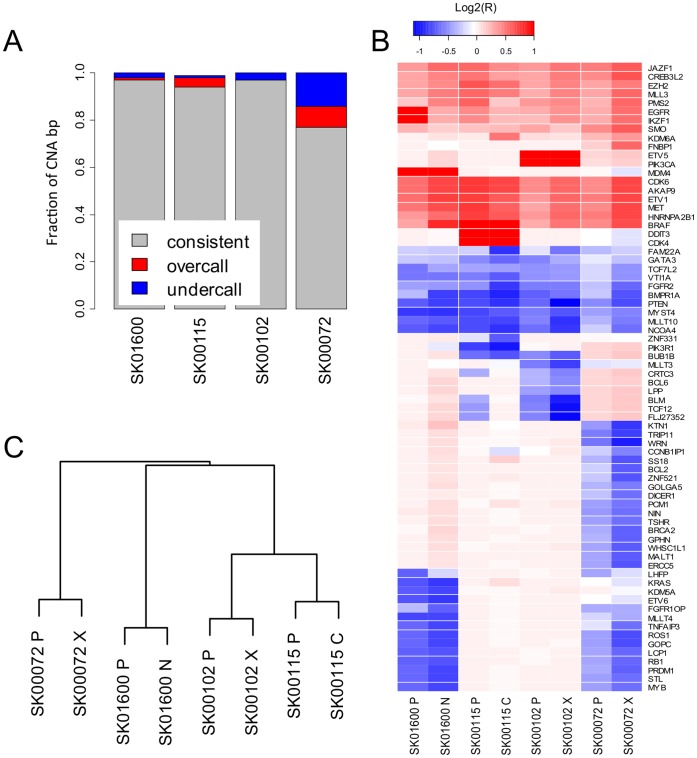
Recent advances in the ability to efficiently characterize tumor genomes is enabling targeted drug development, which requires rigorous biomarker-based patient selection to increase effectiveness. Consequently, representative DNA biomarkers become equally important in pre-clinical studies. However, it is still unclear how well these markers are maintained between the primary tumor and the patient-derived tumor models. Here, we report the comprehensive identification of somatic coding mutations and copy number aberrations in four glioblastoma (GBM) primary tumors and their matched pre-clinical models: serum-free neurospheres, adherent cell cultures, and mouse xenografts. We developed innovative methods to improve the data quality and allow a strict comparison of matched tumor samples. Our analysis identifies known GBM mutations altering PTEN and TP53 genes, and new actionable mutations such as the loss of PIK3R1, and reveals clear patient-to-patient differences. In contrast, for each patient, we do not observe any significant remodeling of the mutational profile between primary to model tumors and the few discrepancies can be attributed to stochastic errors or differences in sample purity. Similarly, we observe ∼96% primary-to-model concordance in copy number calls in the high-cellularity samples. In contrast to previous reports based on gene expression profiles, we do not observe significant differences at the DNA level between in vitro compared to in vivo models. This study suggests, at a remarkable resolution, the genome-wide conservation of a patient's tumor genetics in various pre-clinical models, and therefore supports their use for the development and testing of personalized targeted therapies.
Conflict of interest statement
Figures
References
-
- Varela I, Tarpey P, Raine K, Huang D, Ong CK, et al. (2011) Exome sequencing identifies frequent mutation of the SWI/SNF complex gene PBRM1 in renal carcinoma. Nature 469: 539–542 doi:10.1038/nature09639. - DOI - PMC - PubMed
-
- Jones S, Wang T-L, Shih I-M, Mao T-L, Nakayama K, et al. (2010) Frequent Mutations of Chromatin Remodeling Gene ARID1A in Ovarian Clear Cell Carcinoma. Science (New York, N.Y.) 330: 228–31 doi:10.1126/science.1196333. - DOI - PMC - PubMed
-
- Ng KP, Hillmer AM, Chuah CTH, Juan WC, Ko TK, et al. (2012) A common BIM deletion polymorphism mediates intrinsic resistance and inferior responses to tyrosine kinase inhibitors in cancer. Nat Med 18: 521–528. - PubMed
Publication types
MeSH terms
Grants and funding
- K08CA124804/CA/NCI NIH HHS/United States
- 1R21CA152613-01/CA/NCI NIH HHS/United States
- K08 CA124804/CA/NCI NIH HHS/United States
- R21 CA155615/CA/NCI NIH HHS/United States
- P30 CA023100/CA/NCI NIH HHS/United States
- R21 CA152613/CA/NCI NIH HHS/United States
- UL1 RR031980/RR/NCRR NIH HHS/United States
- UL1 TR000100/TR/NCATS NIH HHS/United States
- 3P30CA023100-25S8/CA/NCI NIH HHS/United States
- UL1RR031980/RR/NCRR NIH HHS/United States
- 1R21CA155615-01A1/CA/NCI NIH HHS/United States
- R01 CA069375/CA/NCI NIH HHS/United States
- UL1TR000100/TR/NCATS NIH HHS/United States
- CA69375/CA/NCI NIH HHS/United States
LinkOut - more resources
Full Text Sources
Other Literature Sources
Medical
Research Materials
Miscellaneous
