. 2013;8(2):e57090.
doi: 10.1371/journal.pone.0057090. Epub 2013 Feb 18.

A C. trachomatis cloning vector and the generation of C. trachomatis strains expressing fluorescent proteins under the control of a C. trachomatis promoter

Affiliations

A C. trachomatis cloning vector and the generation of C. trachomatis strains expressing fluorescent proteins under the control of a C. trachomatis promoter

Hervé Agaisse et al. PLoS One. 2013.

Abstract

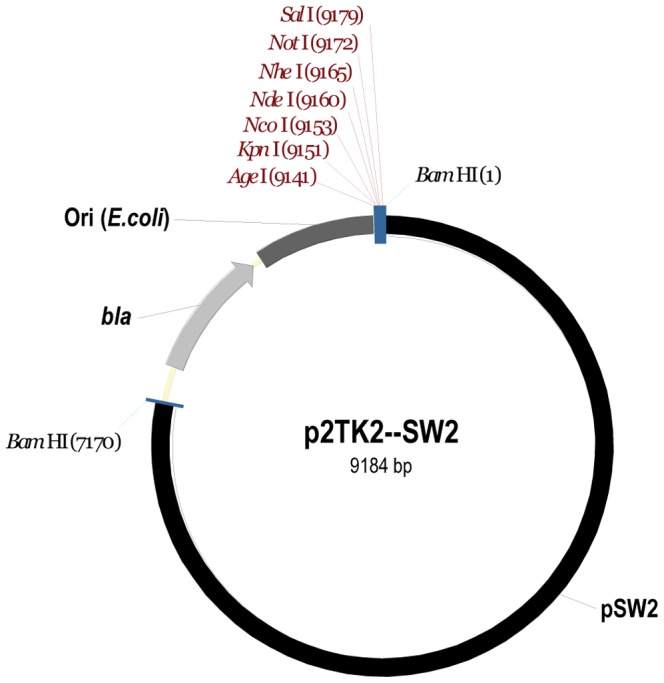
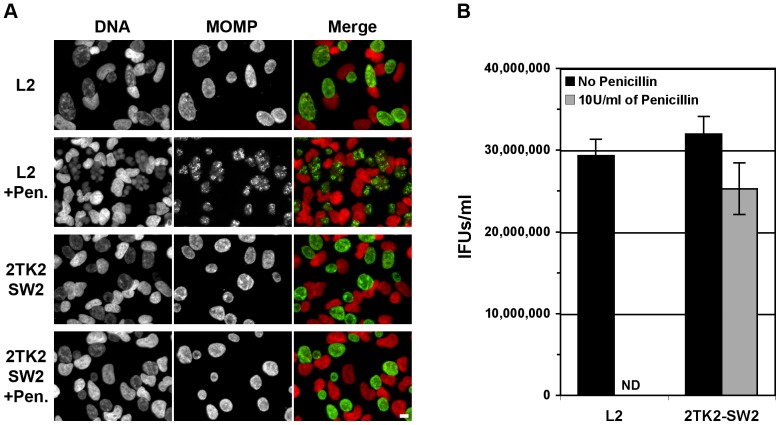
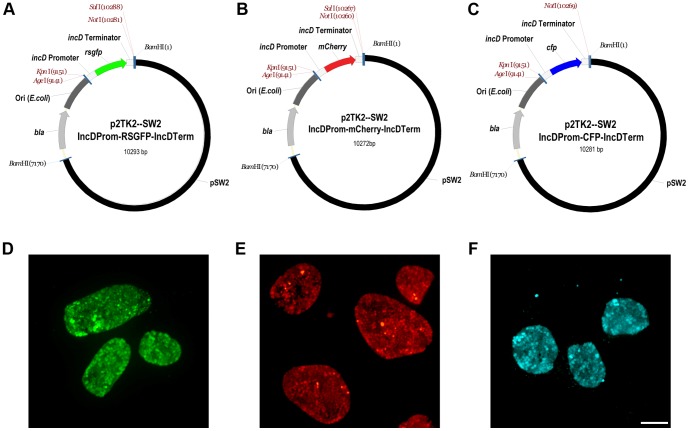
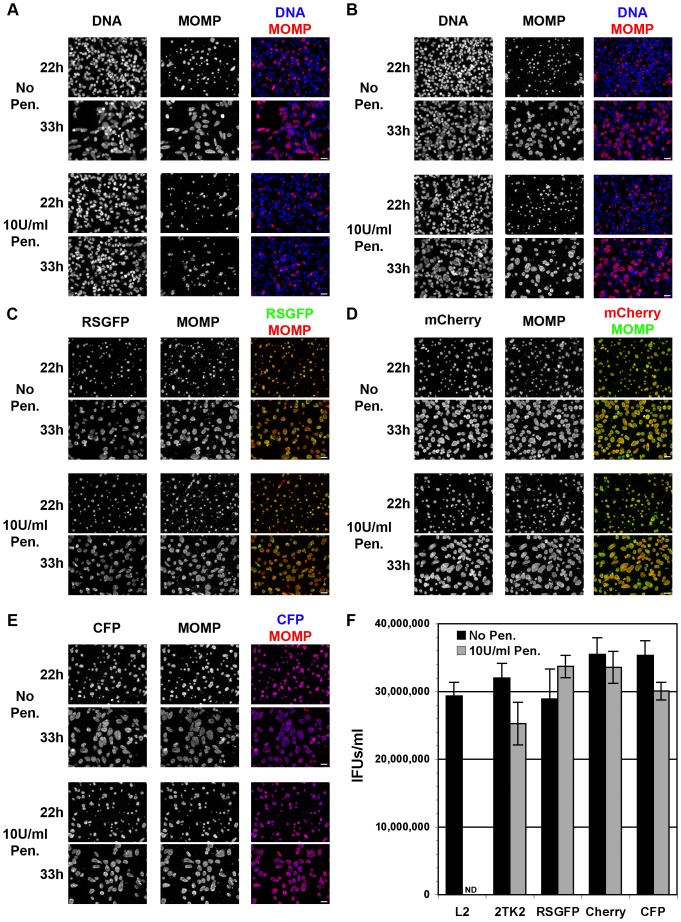
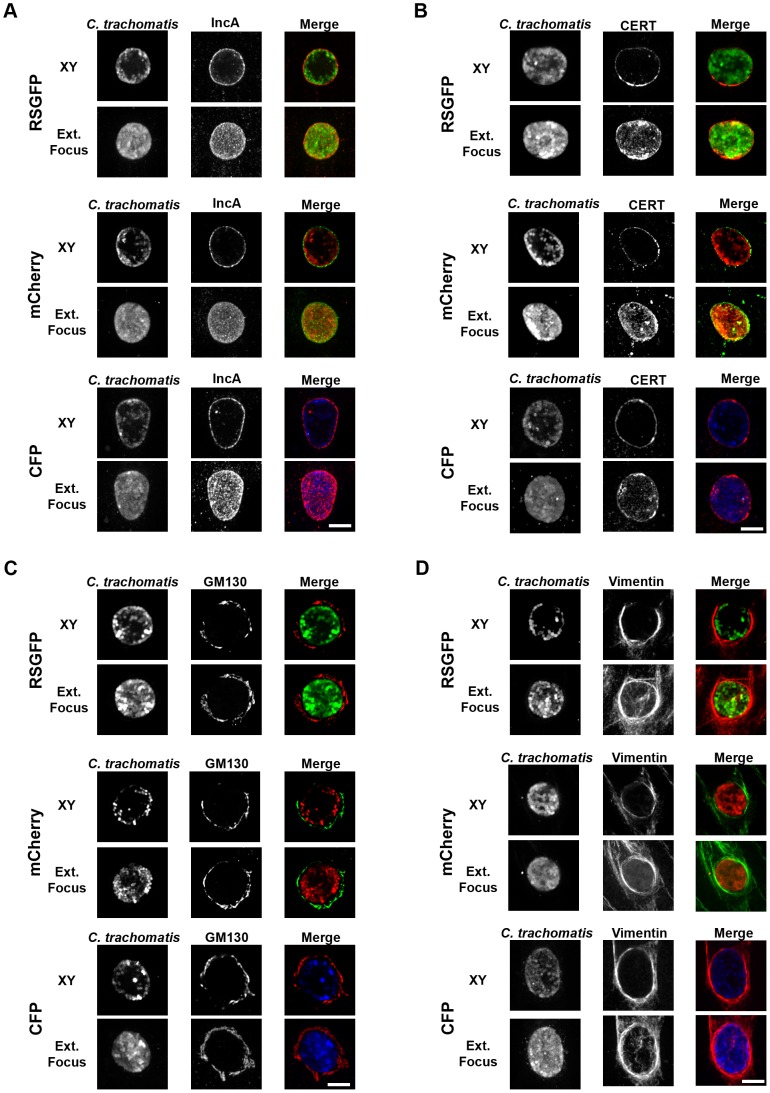
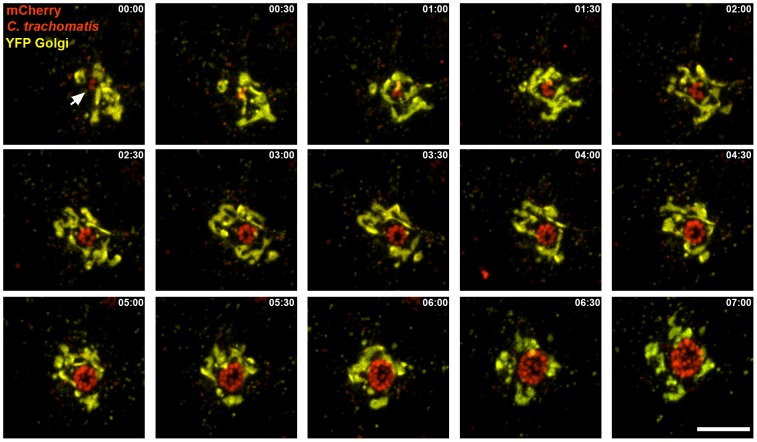
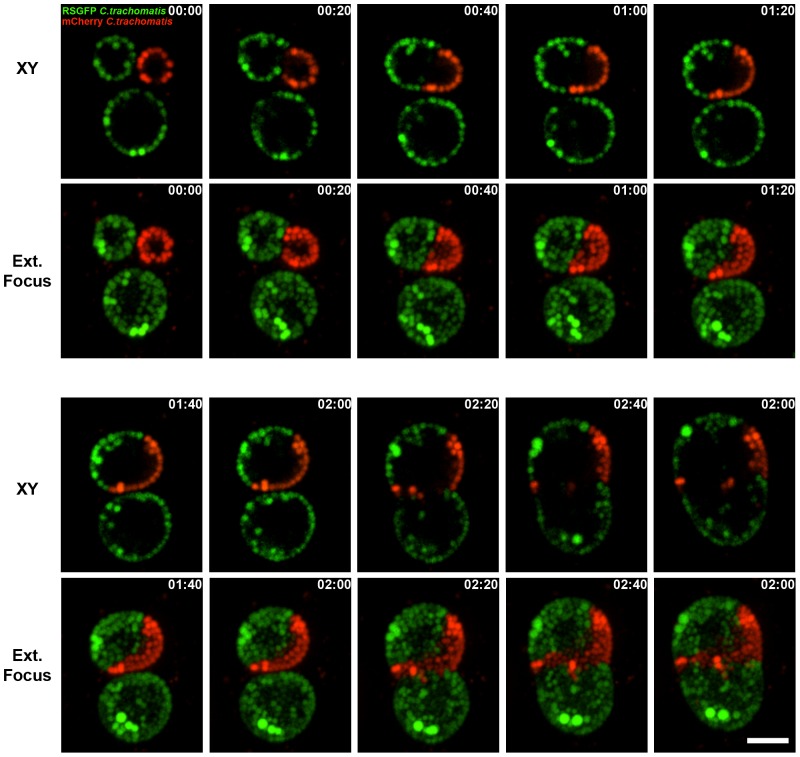
Here we describe a versatile cloning vector for conducting genetic experiments in C. trachomatis. We successfully expressed various fluorescent proteins (i.e. GFP, mCherry and CFP) from C. trachomatis regulatory elements (i.e. the promoter and terminator of the incDEFG operon) and showed that the transformed strains produced wild type amounts of infectious particles and recapitulated major features of the C. trachomatis developmental cycle. C. trachomatis strains expressing fluorescent proteins are valuable tools for studying the C. trachomatis developmental cycle. For instance, we show the feasibility of investigating the dynamics of inclusion fusion and interaction with host proteins and organelles by time-lapse video microscopy.


Conflict of interest statement

Competing Interests: The authors have declared that no competing interests exist.

Figures

Figure 1
Figure 1. A versatile cloning vector for C. trachomatis.
Map of p2TK-SW2. The pSW2 plasmid is shown in black, the E.coli origin of replication in dark grey and the ampicillin resistance cassette (bla) in light grey. Unique restriction sites of the multiple cloning site are shown in red.
Figure 2
Figure 2. Growth characteristics of C. trachomatis L2 and the transformed strain harboring p2TK2--SW2.
A. HeLa cells were infected with the parental strain, C. trachomatis L2, or the transformed strain harboring p2TK2--SW2 for 24 h in the absence (L2 and 2TK2SW2) or presence of penicillin (L2+Pen and 2TK2SW2+Pen). Fixed samples were stained with the DNA dye Hoechst (DNA, left panels) and antibodies against Chlamydia Major Outer Membrane Protein (MOMP) (MOMP, middle panels) were used to visualize the bacteria. The merge images are shown on the right (Red: DNA, Green: MOMP). Scale bar: 10 µm. B. HeLa cells were infected with the parental strain, C. trachomatis L2, or the transformed strain harboring p2TK2--SW2 in the absence (Black bars, No Penicillin) or in the presence of penicillin (Grey bars, 10 U/ml Penicillin). The number of infectious particles (IFUs) recovered 48 h post infection was determined. ND: None Detected.
Figure 3
Figure 3. C. trachomatis transformants expressing RSGFP, mCherry or CFP from the incD gene promoter.
A–C Maps of the p2TK-SW2 derivatives allowing expression of RSGFP (A), mCherry (B) or CFP (C) from the incDEFG operon promoter. The pSW2 plasmid is shown in black, the E.coli origin of replication in dark grey and the ampicillin resistance cassette (bla) in light grey. The rsgfp (green), mCherry (red) and cfp (blue) ORFs are flanked by the incDEFG operon promoter and terminator (light grey). Unique restriction sites are shown in red. D–F. Immunofluorescence images of C. trachomatis inclusions harboring bacteria expressing RSGFP (D), mCherry (E) or CFP (F) from the incDEFG operon promoter. Scale Bar: 10 µm.
Figure 4
Figure 4. Growth characteristics of C. trachomatis L2 and the transformed strain expressing RSGFP, mCherry or CFP from the incD gene promoter.
A–E HeLa cells were infected with the parental strain, C. trachomatis L2 (A), or the transformed strain harboring p2TK2-SW2 (B), p2TK2-SW2 IncDProm-RSGFP-IncDTerm (C), p2TK2-SW2 IncDProm-mCherry-IncDTerm (D) or p2TK2-SW2 IncDProm-CFP-IncDTerm (E) in the absence (No Pen.) or presence (10 U/ml Pen.) of penicillin. Samples were fixed 22 h and 33 h post infection and stained with the DNA dye Hoechst (AB) (DNA, left panels) and antibodies against Chlamydia Major Outer Membrane Protein (MOMP) (AE) (MOMP, middle panels) to visualize the inclusions. GFP (C), mCherry (D) and CFP (E) images are shown on the left panels. The merge images are shown on the right. Scale Bar: 25 µm. F. HeLa cells were infected with the parental strain, C. trachomatis L2 (L2), or the transformed strains harboring p2TK2-SW2 (2TK2), p2TK2-SW2 IncDProm-RSGFP-IncDTerm (RSGFP), p2TK2-SW2 IncDProm-mCherry-IncDTerm (Cherry) or p2TK2-SW2 IncDProm-CFP-IncDTerm (CFP) in the absence (Black bars, No Pen.) or in the presence of penicillin (Grey bars, 10 U/ml Pen.). The number of infectious particles (IFUs) recovered 48 h post infection was determined. ND: Not Detected.
Figure 5
Figure 5. C. trachomatis strains expressing RSGFP, mCherry or CFP from the incD gene promoter recapitulate major features observed during C. trachomatis developmental cycle.
A–D. HeLa cells were infected with C. trachomatis transformed strains harboring p2TK2-SW2 IncDProm-RSGFP-IncDTerm (RSGFP), p2TK2-SW2 IncDProm-mCherry-IncDTerm (mCherry) or p2TK2-SW2 IncDProm-CFP-IncDTerm (CFP) for 24 h. Samples were fixed and stained with antibodies against IncA (A), CERT (B), GM130 (C) and Vimentin (D). Images were acquired using a spinning disc confocal microscope. For each strain and each marker, an XY view (Top panels, XY) and an extended focus view (Bottom Panels, Ext.Focus) are shown. Scale bar: 10 µm.
Figure 6
Figure 6. Time-lapse video microscopy of the association of C. trachomatis inclusion with the Golgi apparatus during the early stages of the developmental cycle.
Selected merged frames from Video S1 acquired every 30 minutes by time-lapse video microscopy of HeLa cells transiently transfected with a YFP-Golgi construct (yellow) and infected with C. trachomatis expressing mCherry under the control of the incD promoter (red). The first frame corresponds to 10 h post infection. The time (hours: minutes) is indicated in the upper right corner of each frame. Scale Bar: 10 µm.
Figure 7
Figure 7. Time-lapse video microscopy of C. trachomatis inclusion fusion.
Selected merged frames from Video S2 acquired every 20 minutes by time-lapse video microscopy of HeLa cells co-infected with C. trachomatis strains expressing GFP (green) or mCherry (red) under the control of the incD promoter. The first frame corresponds to 24 h post infection. For each time point, an XY view (Top panels, XY) and an extended focus view (Bottom Panels, Ext.Focus) are shown. The time (hours: minutes) is indicated in the upper right corner of each frame. Scale Bar: 6 µm.

References

    1. Friis RR (1972) Interaction of L cells and Chlamydia psittaci: entry of the parasite and host responses to its development. J Bacteriol 110: 706–721. - PMC - PubMed
    1. Moulder JW (1991) Interaction of chlamydiae and host cells in vitro. Microbiol Rev 55: 143–190. - PMC - PubMed
    1. Betts HJ, Wolf K, Fields KA (2009) Effector protein modulation of host cells: examples in the Chlamydia spp. arsenal. Curr Opin Microbiol 12: 81–87. - PubMed
    1. Cocchiaro JL, Valdivia RH (2009) New insights into Chlamydia intracellular survival mechanisms. Cell Microbiol 11: 1571–1578. - PMC - PubMed
    1. Saka HA, Valdivia RH (2010) Acquisition of nutrients by Chlamydiae: unique challenges of living in an intracellular compartment. Curr Opin Microbiol 13: 4–10. - PMC - PubMed

Publication types

Substances

LinkOut - more resources