Case Reports
. 2013 Jan;9(1):198-209.
doi: 10.4161/hv.22828.

Tumor-induced endothelial cell surface heterogeneity directly affects endothelial cell escape from a cell-mediated immune response in vitro

Affiliations
Case Reports

Tumor-induced endothelial cell surface heterogeneity directly affects endothelial cell escape from a cell-mediated immune response in vitro

Petr G Lokhov et al. Hum Vaccin Immunother. 2013 Jan.

Abstract

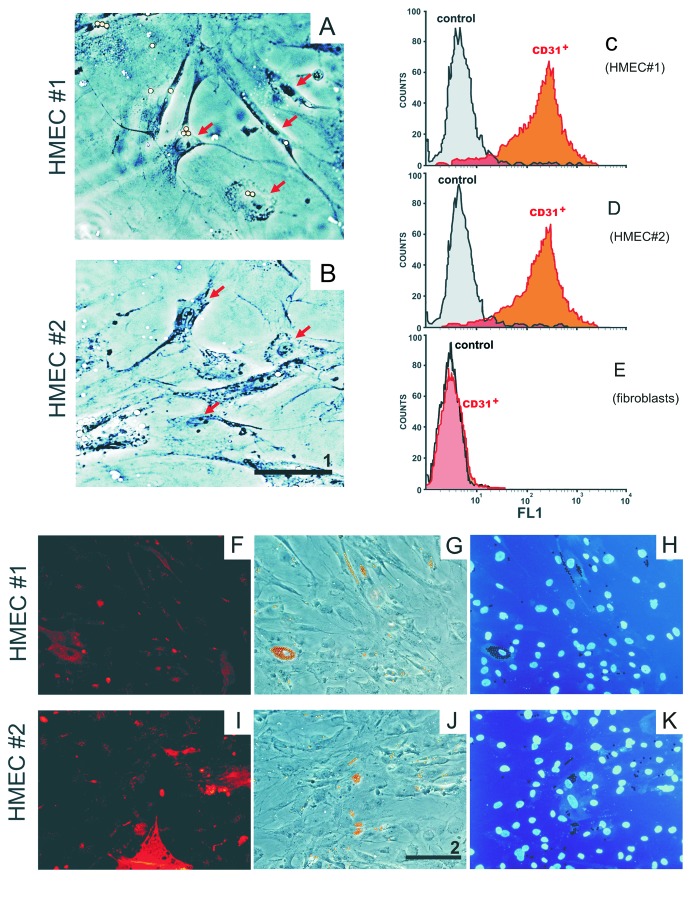
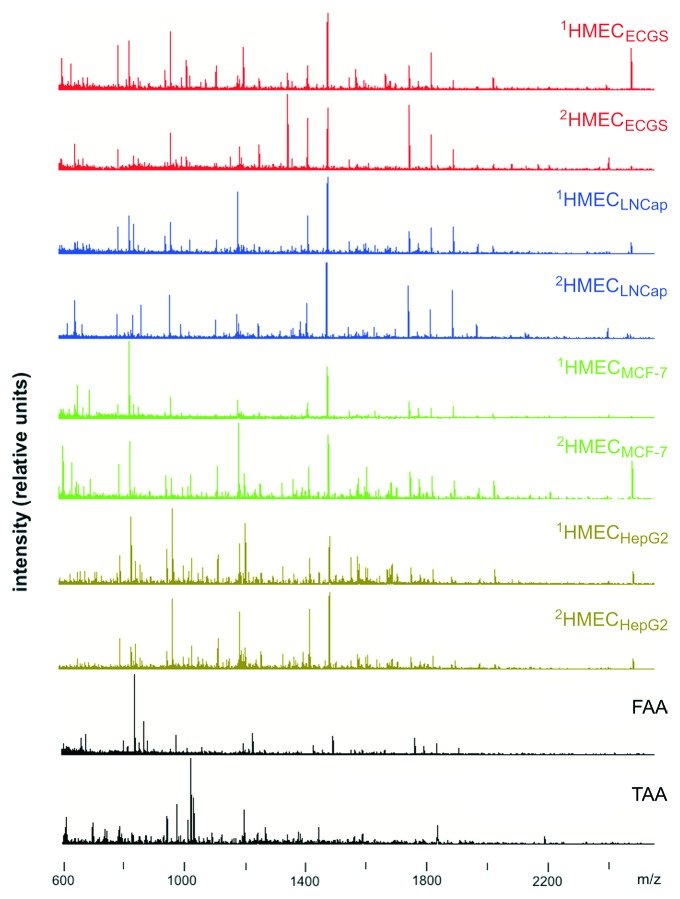
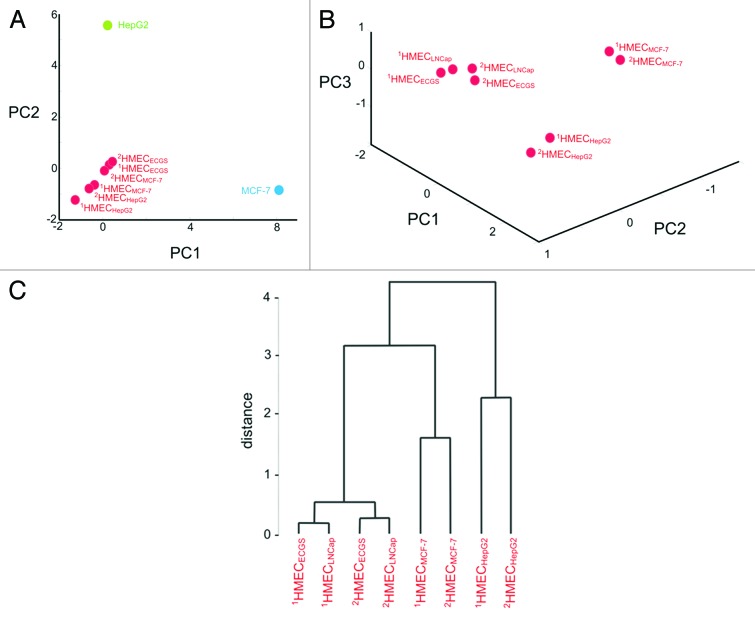
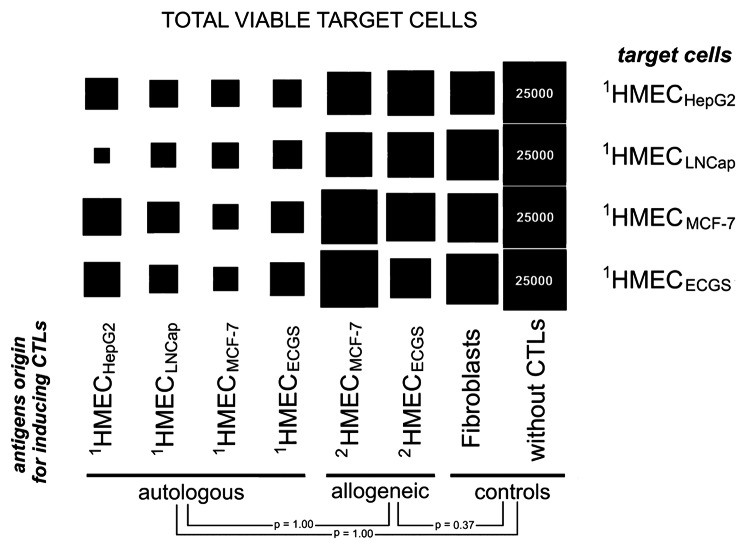
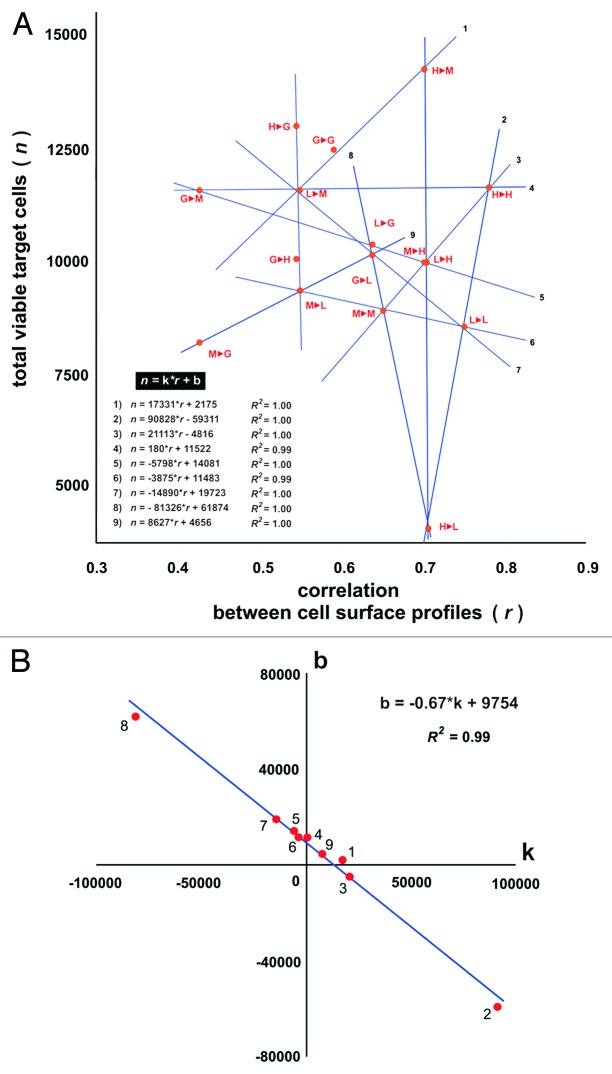
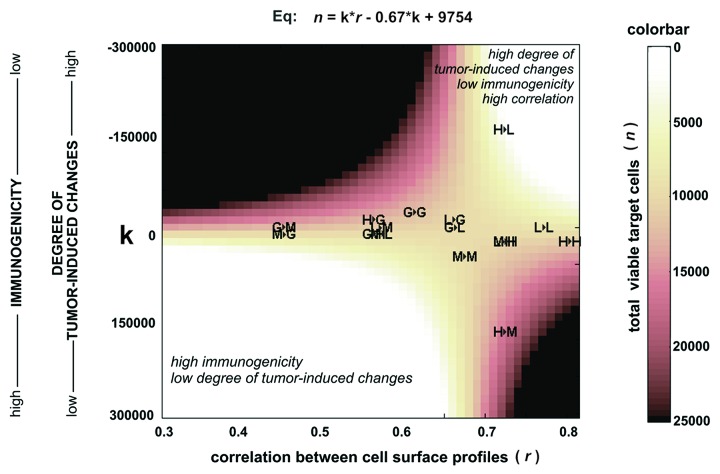
Immune-mediated damage to tumor vessels is a potential means of preventing solid tumor progression. Antiangiogenic cancer vaccines capable of inducing this kind of damage include formulations comprised of endothelial cell-specific antigens. Identification of antigens capable of eliciting efficient vaccination is difficult because the endothelial cell phenotype is affected by surrounding tissues, including angiogenic stimuli received from surrounding tumor cells. Therefore, phenotype endothelial cell variations (heterogeneity) were examined in the context of the development of an efficient vaccine using mass spectrometry-based cell surface profiling. This approach was applied to primary human microvascular endothelial cell (HMEC) cultures proliferated under growth stimuli provided by either normal tissues (growth supplement from human hypothalamus) or cancer cells (MCF-7, LNCap and HepG2). It was found that tumors induced pronounced, tumor type-dependent changes to HMEC surface targets that in an in vitro model of human antiangiogenic vaccination directly facilitated HMEC escape from cytotoxic T cell-mediated cell death. Furthermore, it was found that tumors influenced the HMEC phenotype unidirectionally and that HMEC imunogenicity was reciprocal to the intensity of tumor-induced changes to the HMEC surface. These findings provide data for the design of tumor-specific endothelial cell based vaccines with sufficient immunogenicity without posing a risk to the elicitation of autoimmunity if administered in vivo.

Keywords: antiangiogenic cancer vaccine; cell heterogeneity; cell proteomic footprinting; cell surface profiling; microvascular endothelial cells; vaccine design.


Figures

None
Figure 1. Primary HMEC cultures. A representative HMEC from donor 1 (A) and donor 2 (B). HMEC have numerous cytoplasmic extensions and/or cobblestone-like morphology (arrows) typical for adipose-derived microvascular endothelial cells. Flow cytometric analysis of HMEC cultures from donor 1 (C) and donor 2 (D). Cells were stained with mouse anti-human CD31 antibody (biotinylated horse anti-mouse IgG as secondary antibody and streptavidin-RPE as a fluorescent label). Fluorescently stained cells are labeled as “CD31+.” Baseline florescence was determined using the same cells exposed only to the biotinylated secondary antibody and streptavidin-RPE (labeled as “control”). Immunofluorescent staining of CD31+ cells (F and I) correspond to donors 1 and 2, respectively. Microscopic images (G and J) and DAPI staining of nuclei from cells (H and K) depicted in (F and I). Images were obtained using a Leiса DM5000B microscope (scale bar #1, 20 µm; scale bar #2, 50 µm). Adult skin fibroblasts were used as negative anti-C31-binding control (E).
None
Figure 2. Mass spectra used to generate cell surface profiles. Representative spectra of EAA of HMEC obtained from donor 1 and donor 2 stimulated using endothelial cell growth supplement (1HMECECGS and 2HMECECGS), conditioned medium from MCF-7 cells (1HMECMCF-7 and 2HMECMCF-7), LNCap cells (1HMECLNCap and 2HMECLNCap), or HepG2 cells (1HMECHepG2 and 2HMECHepG2). Superscript numbers correspond to donor 1 or 2, respectively. The mass spectra of fibroblast-associated antigens (FAA) and tumor(MCF-7 cells)-associated antigens (TAA) are also shown.
None
Figure 3. Principal component analysis (PCA) of cell surface profiles. PCA of cell surface profiles obtained from HMEC and cancer cells that were projected in the space of the first two principal components (A). PCA of cell surface profiles obtained only for HMEC projected into the space of the first 3 principal components (B) and the dendrogram depicting the distances measured between points (C). “1HMECECGS” and “2HMECECGS” - cell surface profile of HMEC stimulated to grow in the presence of endothelial cell growth supplement; “1HMECMCF-7” and “2HMECMCF-7” - cell surface profile of HMEC stimulated to grow in the presence of MCF-7 cell conditioned medium; “1HMECLNCap” and “2HMECLNCap” - cell surface profiles of HMEC stimulated to grow in the presence of LNCap cell conditioned medium; “1HMECHepG2” and “2HMECHepG2” - cell surface profiles of HMEC stimulated to grow in the presence of HepG2 cell conditioned medium; the “MCF-7” - point corresponds to the cell surface profile obtained from MCF-7 cells; the “HepG2” - point corresponds to the cell surface profile obtained from HepG2 cells.
None
Figure 4. Cytotoxicity of effector CTLs against HMEC. Target HMEC cells (3.7 × 10⁴ cells/well) were incubated in the presence of effector CTLs at a 1:8 ratio. After 3 d, floating CTLs were removed, target cells carefully washed with HBSS, attached HMEC were trypsinized and cell viability determined. Square size reflects viable target cell counts. Data was scaled to bring all controls (target cells incubated without CTLs) to equal values (25,000 cells). Data represent the mean value of 3 independent measurements. The standard deviations for the number of viable cells were in the 1,200–3,400 cell range. P values determined by t-test.
None
Figure 5. Cytotoxicity of effector CTLs against target HMEC plotted vs. correlation of cell surface profiles (A) and plotted coefficients of linear equations that describe the dependence of cytotoxicity from the correlation of cell surface profiles (B). (A) Autologous EC antigens were used to induce CTLs. The average number of viable target cells in 3 wells is presented. Accuracy of liner approximation (R2) was achieved using coordinates of 3 respective points. Equations for linear approximations are shown on the plot. Correlation values (coefficient r) were calculated for HMEC surface profiles used to generate antigens (EAA) for eliciting immune response and the surface profile of target HMEC used in same cytotoxicity assay. “1►2” – 1st letter corresponds to HMEC used to generate antigens (EAA) for eliciting immune response in the cytotoxicity assays; 2nd letter corresponds to the target HMEC used in the same cytotoxicity assay. “G” – 1HMECECGS; “M” – 1HMECMCF-7; “L” – 1HMECLNCap; “H” – 1HMECHepG2. (B) “k” and “b” values correspond to coefficients of linear equations showed on plot (A). Equation of linear approximation of the coordinates and accuracy of this approximation (R2) are shown on the plot.
None
Figure 6. Cytotoxicity of effector CTLs against target HMEC plotted according to equation (Eq) that describes the dependence of cytotoxicity from the correlation of cell surface profiles (r) and intensity of tumor-induced changes (k) at the HMEC surface. Autologous EC antigens were used to induce CTLs. Correlation values (coefficient r) were calculated for HMEC surface profiles used to generate antigens (EAA) for eliciting immune response and the surface profile of target HMEC used in same cytotoxicity assay. Results of cytotoxicity assays are projected on the plot. “1►2” -1st letter corresponds to HMEC used to generate antigens (EAA) for eliciting immune response in the cytotoxicity assays; 2nd letter corresponds to the target HMEC used in the same cytotoxicity assay. “G” -1HMECECGS; “M” -1HMECMCF-7; “L”- 1HMECLNCap; “H” -1HMECHepG2. The equation was developed from equations described in the “Discussion.”

References

    1. Lollini PL, Cavallo F, Nanni P, Forni G. Vaccines for tumour prevention. Nat Rev Cancer. 2006;6:204–16. doi: 10.1038/nrc1815. - DOI - PubMed
    1. Trial watch : Progress for Phase III cancer vaccines. Nat Rev Drug Discov. 2008;7:966–7. doi: 10.1038/nrd2766. No_authors_listed. - DOI - PubMed
    1. Boehm T, Folkman J, Browder T, O’Reilly MS. Antiangiogenic therapy of experimental cancer does not induce acquired drug resistance. Nature. 1997;390:404–7. doi: 10.1038/37126. - DOI - PubMed
    1. Bussolino F, Arese M, Audero E, Giraudo E, Marchiò S, Mitola S, et al. Biological aspects of tumour angiogenesis. Cancer Modelling and Simulation. London: Chapman and Hall/CRC; 2003. p. 1–22.
    1. Folkman J. Tumor angiogenesis: therapeutic implications. N Engl J Med. 1971;285:1182–6. doi: 10.1056/NEJM197111182852108. - DOI - PubMed

Publication types

Substances

LinkOut - more resources