

A preparation of murine liver fragments for in vitro studies: liver preparation for toxicological studies
- PMID: 23442607
- PMCID: PMC3598918
- DOI: 10.1186/1756-0500-6-70
A preparation of murine liver fragments for in vitro studies: liver preparation for toxicological studies
Abstract
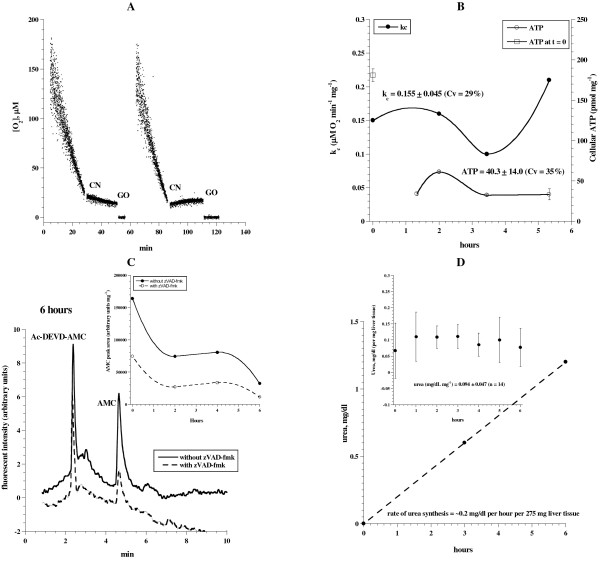
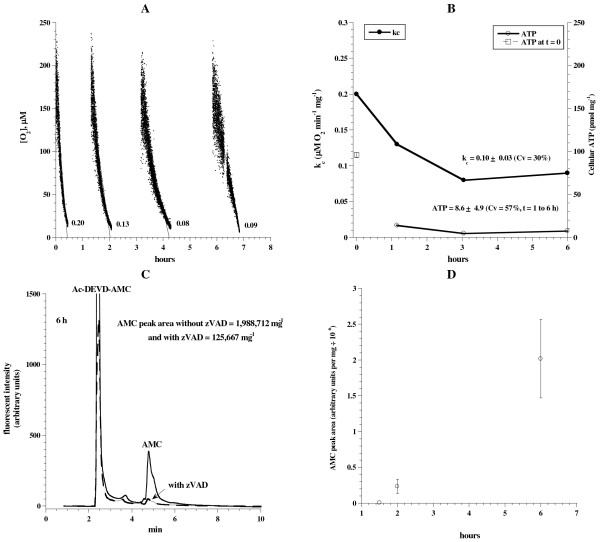
Background: The aim of this study was to develop liver tissue preparation suitable for investigating toxins. Hepatocyte respiration, ATP content, urea synthesis, caspase activity and morphology were measured as a function of in vitro incubation time. Mice were anesthetized by sevoflurane inhalation. Small liver fragments were then rapidly excised and incubated at 37°C in Krebs-Henseleit buffer (continuously gassed with 95% O2: 5% CO2) for up to 6 h. Phosphorescence O2 analyzer was used to determine the rate of cellular mitochondrial O2 consumption (kc, μM O2 min-1 mg-1). Cellular ATP was measured using the luciferin/luciferase system. The caspase-3 substrate N-acetyl-asp-glu-val-asp-7-amino-4-methylcoumarin (Ac-DEVD-AMC) was used to monitor intracellular caspase activity; cleaved AMC moieties (reflecting caspase activity) were separated on HPLC and detected by fluorescence.
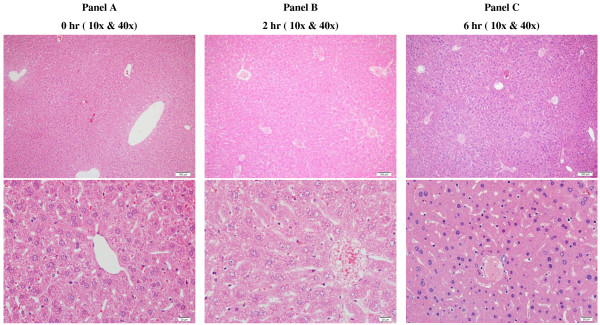
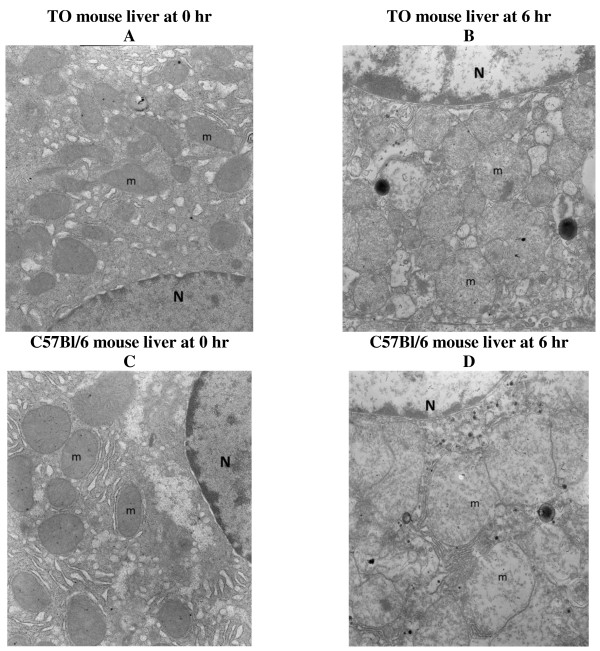
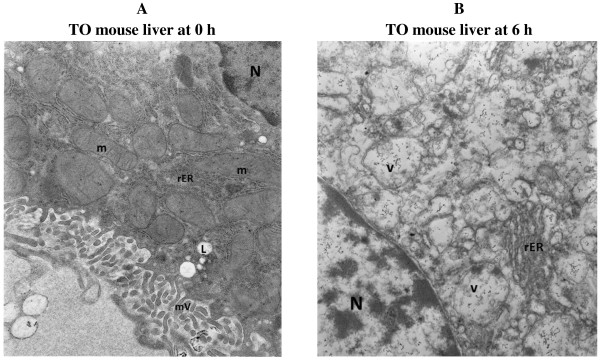
Findings: Respiration was inhibited by cyanide, confirming the oxidation occurred in the respiratory chain. The values of kc (mean ± SD) for 0≤ t ≤6 h were 0.15 ± 0.02 μM O2 min-1 mg-1 (n = 18, coefficient of variation, CV = 13%), ATP content 131 ± 69 pmol mg-1 (1≤ t ≤6 h, n = 16, CV = 53%), synthesized urea 0.134 ± 0.017 mg/dL mg-1 in 50 min (0≤ t ≤6 h, n = 14, CV = 13%), and AMC peak area 62,540 ± 26,227 arbitrary units mg-1 (1≤ t ≤6 h, n = 3, CV = 42%). Hepatocyte morphology and organelles were reasonably persevered.
Conclusions: The described liver tissue preparation demonstrates stable hepatocyte structure, ultrastructure and biomarkers for up to 6 h, permitting in vitro studies.
Figures
Similar articles
-
Lung tissue bioenergetics and caspase activity in rodents.BMC Res Notes. 2013 Jan 12;6:12. doi: 10.1186/1756-0500-6-12. BMC Res Notes. 2013. PMID: 23311890 Free PMC article.
-
Bioenergetic study of murine hepatic tissue treated in vitro with atorvastatin.BMC Pharmacol Toxicol. 2013 Feb 28;14:15. doi: 10.1186/2050-6511-14-15. BMC Pharmacol Toxicol. 2013. PMID: 23448291 Free PMC article.
-
Bioenergetics of murine lungs infected with respiratory syncytial virus.Virol J. 2013 Jan 15;10:22. doi: 10.1186/1743-422X-10-22. Virol J. 2013. PMID: 23320837 Free PMC article.
-
Measurement of oxygen consumption by murine tissues in vitro.J Pharmacol Toxicol Methods. 2011 Mar-Apr;63(2):196-204. doi: 10.1016/j.vascn.2010.10.002. Epub 2010 Oct 27. J Pharmacol Toxicol Methods. 2011. PMID: 21034836
-
Regulation of energy metabolism in liver.J Bioenerg Biomembr. 1995 Dec;27(6):571-82. doi: 10.1007/BF02111655. J Bioenerg Biomembr. 1995. PMID: 8746844 Review.
Cited by
-
The mTOR inhibitor sirolimus suppresses renal, hepatic, and cardiac tissue cellular respiration.Int J Physiol Pathophysiol Pharmacol. 2015 Mar 20;7(1):54-60. eCollection 2015. Int J Physiol Pathophysiol Pharmacol. 2015. PMID: 26069529 Free PMC article.
-
In vitro assessment of antitumor activities of the PI3K/mTOR inhibitor GSK2126458.Cancer Cell Int. 2014 Sep 24;14(1):90. doi: 10.1186/s12935-014-0090-z. eCollection 2014. Cancer Cell Int. 2014. PMID: 25298748 Free PMC article.
-
In vitro effects of platinum compounds on renal cellular respiration in mice.Int J Clin Exp Pathol. 2015 Jan 1;8(1):81-95. eCollection 2015. Int J Clin Exp Pathol. 2015. PMID: 25755695 Free PMC article.
-
The mTOR inhibitor sirolimus suppresses renal, hepatic, and cardiac tissue cellular respiration.Int J Clin Exp Pathol. 2015 Mar 1;8(3):2955-62. eCollection 2015. Int J Clin Exp Pathol. 2015. Retraction in: Int J Clin Exp Pathol. 2015 Oct 01;8(10):13783. PMID: 26045804 Free PMC article. Retracted.
-
Profiling cellular bioenergetics, glutathione levels, and caspase activities in stomach biopsies of patients with upper gastrointestinal symptoms.World J Gastroenterol. 2015 Jan 14;21(2):644-52. doi: 10.3748/wjg.v21.i2.644. World J Gastroenterol. 2015. PMID: 25593494 Free PMC article.
References
-
- Al-Shamsi M, Al-Samri M, Al-Salam S, Conca W, Benedict S. Biocompatibility study of mesoporous silicate particles with cellular bioenergetics in murine tissues. Chem Res Toxicol. 2010;11:1796–1805. - PubMed
Publication types
MeSH terms
Substances
LinkOut - more resources
Full Text Sources
Other Literature Sources
Research Materials
Miscellaneous
