. 2013 Feb 27:13:93.
doi: 10.1186/1471-2407-13-93.

Transposon activation mutagenesis as a screening tool for identifying resistance to cancer therapeutics

Affiliations

Transposon activation mutagenesis as a screening tool for identifying resistance to cancer therapeutics

Li Chen et al. BMC Cancer. .

Abstract

Background: The development of resistance to chemotherapies represents a significant barrier to successful cancer treatment. Resistance mechanisms are complex, can involve diverse and often unexpected cellular processes, and can vary with both the underlying genetic lesion and the origin or type of tumor. For these reasons developing experimental strategies that could be used to understand, identify and predict mechanisms of resistance in different malignant cells would be a major advance.

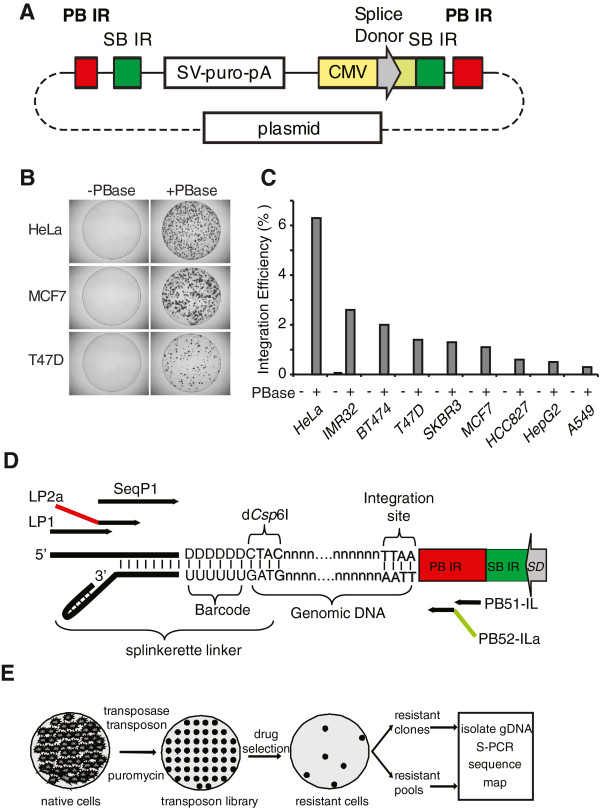
Methods: Here we describe a gain-of-function forward genetic approach for identifying mechanisms of resistance. This approach uses a modified piggyBac transposon to generate libraries of mutagenized cells, each containing transposon insertions that randomly activate nearby gene expression. Genes of interest are identified using next-gen high-throughput sequencing and barcode multiplexing is used to reduce experimental cost.

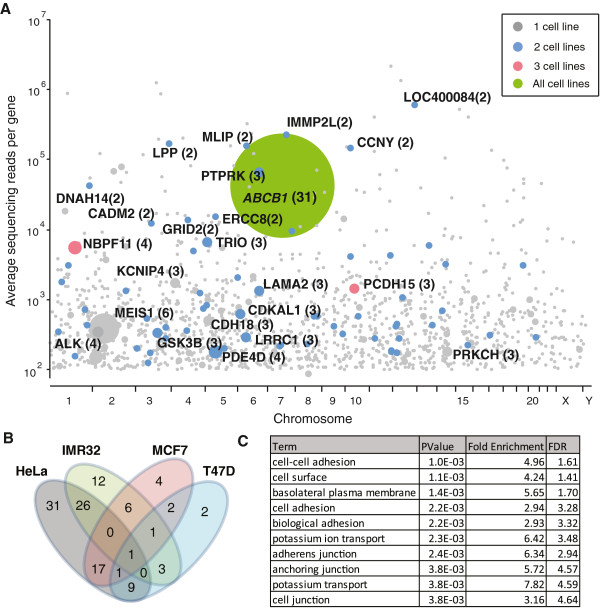
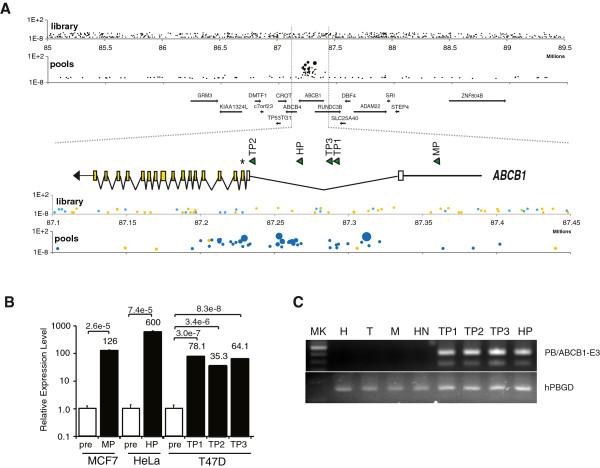
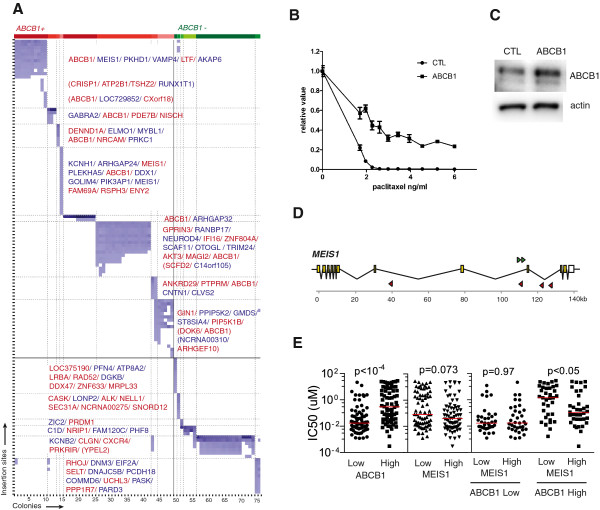
Results: Using this approach we successfully identify genes involved in paclitaxel resistance in a variety of cancer cell lines, including the multidrug transporter ABCB1, a previously identified major paclitaxel resistance gene. Analysis of co-occurring transposons integration sites in single cell clone allows for the identification of genes that might act cooperatively to produce drug resistance a level of information not accessible using RNAi or ORF expression screening approaches.

Conclusion: We have developed a powerful pipeline to systematically discover drug resistance in mammalian cells in vitro. This cost-effective approach can be readily applied to different cell lines, to identify canonical or context specific resistance mechanisms. Its ability to probe complex genetic context and non-coding genomic elements as well as cooperative resistance events makes it a good complement to RNAi or ORF expression based screens.


Figures

Figure 1
Figure 1
Transposon mutagenesis libraries for forward genetic screens. A) Diagram of PB plasmid pPB-SB-CMV-puro-SD. Inverted repeats (IRs) for the PB and SB transposons are shown. The cytomegalovirus enhancer and promoter is drawn as CMV. The rabbit β-globin splice donor is depicted with an arrow indicating its reading outward into adjacent genes. The construct is in a pBluescript-based plasmid vector. B) Transposase is required for transposon integration. Cells were transfected with PB plasmid in presence (+PBase), or absence (−PBase) of transposase plasmid followed by puromycin treatment. C) Transposition efficiency. Shown are PB transposition efficiencies with and without transposase. D) Splinkerette PCR template for insertion site detection. Nested PCR primers contain Illumina adaptors shown as red and green. A 6nt region in the linker (DDDDDD) serves as multiplexing barcodes. E) Mutagenesis and screen flow chart. The mutagenesis prescreened library was generated by transfection and expanded. Following drug selection, resistant samples were either isolated or pooled, and the insertion sites were identified by splinkerette PCR, Illumina sequencing, and mapping to a model genome.
Figure 2
Figure 2
Transposon Mutagenesis library. A) All PB insertion sites in a PB-tagged HeLa library identified by Illumina sequencing were plotted to 23 chromosomes. X-axis indicates nucleotide positions with centromeres drawn as circles and chromosome arms as straight lines. Y-axis indicates raw read number for each site. B) Insertion sites of five clones expanded from single cells, with x-axes indicating genome positions, and y-axis indicating frequency of insertions normalized to the highest signal C) Transposon insertions alter host gene expression. Shown are four genes with PB insertions in various positions and orientations. Gene expression was compared among clones with (+ins), without (−ins) the insertion, and the prescreened library (Lib). Error bars show standard deviation (n=3). Significances were indicated by p-values.
Figure 3
Figure 3
Paclitaxel resistant gene candidates in pooled samples. A) Candidate ‘hits’ identified in resistant pools of four cell lines. Genes found in multiple cell lines are color-coded and labeled. Dot surfaces and numbers within parentheses indicate insertion occurrence, and y-axis indicates total read numbers for each gene. B) Venn diagram showing candidate genes belonging to four cell lines. Only one gene (ABCB1) was shared by all four cell lines. C) Functional annotation analysis of pooled samples. Only genes with multiple hits were used in DAVID analysis. Only annotation groups with significant values (p-value<0.05, FDR<5%) are listed. The complete annotation chart and cluster chart are presented in the Additional file 4 Dataset S4.
Figure 4
Figure 4
ABCB1 as the primary resistant gene. A) Insertion sites near ABCB1 genomic locus are enriched in resistant samples. Insertion sites of a prescreened library and resistant pools in Chr7:85000000–89500000 are plotted. Scale is drawn as per Mb. Dot surfaces indicate number of positive samples, and y-axis indicates normalized read numbers as a percentage of total signals. Read numbers are unfiltered. All annotated genes within this region are shown as arrows. A blow-up view indicates ABCB1 genomic arrangement with open reading frame shown as yellow boxes. Asterisk denotes exon 3 with the ATG start codon (chr7:87229506). Insertion sites confirmed by TOPO cloning and Sanger sequencing are drawn as triangles above the diagram with direction of arrows indicating orientation of the CMV and the splice donor. HP, MP, TP1-3 denote HeLa, MCF7, and T47D paclitaxel resistant clones respectively. Colors of dots indicate orientation of the CMV with forward orientation relative to ABCB1 as blue and reverse orientation as yellow. B) PB insertions activate ABCB1 expression. Error bars show standard deviation (n=3). Significances are indicated by p-values. “pre” denotes prescreened libraries; MP, HP, and TP1-3 denote clones shown above. C) Detection of the chimeric mRNA in clones with insertions in the ABCB1 intron. Top panel (PB/ABCB1-E3) shows 404bp chimeric PCR products with a transposon-specific primer and an ABCB1 exon 3 primer. A lower band at 300bp could be due to alternative splicing. Bottom panel (hPBGD) shows the 151bp PCR products using the primer pair amplifying the porphobilinogen deaminase (PBGD) housekeeping gene. Three native cell lines (H, HeLa; M, MCF7; T, T47D) and a HeLa clone with PB insertions but not in the ABCB1 gene (HN) were used as controls. The first lane (MK) indicates 100bp DNA ladder (New England Biolabs).
Figure 5
Figure 5
Candidate hits in resistant clones. A) Cluster analysis of IMR32 resistant clones. X-axis indicates colonies and y-axis indicates insertion sites. Colonies within a cluster have same insertions and are likely derived from one founder clone. Insertions are in either same (red) or opposite (blue) orientations of a gene. B) Paclitaxel sensitivity curve of IMR32 transfected with a control (CTL) or ABCB1 cDNA plasmid (ABCB1). Cell survival was measured by CellTiter-Glo assay. C) Western blot showing ABCB1 overexpression in IMR32 cells transfected with pCMV-ABCB1 plasmid. CTL, cells transfected with a control pCMV plasmid; ABCB1, cells transfected with pCMV-ABCB1 cDNA plasmid. ABCB1 was shown as bands at 150kD. Actin was used as loading control. D) PB insertions in MEIS1 gene. The direction of gene is drawn from left to right, with yellow squares indicating exons. Forward strand insertion sites are drawn as green triangles and reverse as red triangles. Scale is drawn as per kb. E) Paclitaxel sensitivity profile in a panel of cancer cell lines. Cell lines are either divided to two groups by median ABCB1 or MEIS1 mRNA levels, n=143, (first and second graphs), or first divided by median ABCB1 levels and then by median MEIS1 mRNA levels, n=72 (ABCB1 Low) and 71 (ABCB1 High). Red bars indicate median IC50.

References

    1. Meijer D, van Agthoven T, Bosma PT, Nooter K, Dorssers LC. Functional screen for genes responsible for tamoxifen resistance in human breast cancer cells. Mol Cancer Res. 2006;4(6):379–386. doi: 10.1158/1541-7786.MCR-05-0156. - DOI - PubMed
    1. Johannessen CM, Boehm JS, Kim SY, Thomas SR, Wardwell L, Johnson LA, Emery CM, Stransky N, Cogdill AP, Barretina J. COT drives resistance to RAF inhibition through MAP kinase pathway reactivation. Nature. 2010;468(7326):968–972. doi: 10.1038/nature09627. - DOI - PMC - PubMed
    1. Gaither LA. Chemogenomics approaches to novel target discovery. Expert Rev Proteomics. 2007;4(3):411–419. doi: 10.1586/14789450.4.3.411. - DOI - PubMed
    1. Kool J, Berns A. High-throughput insertional mutagenesis screens in mice to identify oncogenic networks. Nat Rev Cancer. 2009;9(6):389–399. - PubMed
    1. Dorssers LC, van Agthoven T, Dekker A, van Agthoven TL, Kok EM. Induction of antiestrogen resistance in human breast cancer cells by random insertional mutagenesis using defective retroviruses: identification of bcar-1, a common integration site. Mol Endocrinol. 1993;7(7):870–878. doi: 10.1210/me.7.7.870. - DOI - PubMed

Publication types

MeSH terms