. 2013 Feb 25:11:15.
doi: 10.1186/1741-7007-11-15.

Quantifying the contribution of chromatin dynamics to stochastic gene expression reveals long, locus-dependent periods between transcriptional bursts

Affiliations

Quantifying the contribution of chromatin dynamics to stochastic gene expression reveals long, locus-dependent periods between transcriptional bursts

José Viñuelas et al. BMC Biol. .

Abstract

Background: A number of studies have established that stochasticity in gene expression may play an important role in many biological phenomena. This therefore calls for further investigations to identify the molecular mechanisms at stake, in order to understand and manipulate cell-to-cell variability. In this work, we explored the role played by chromatin dynamics in the regulation of stochastic gene expression in higher eukaryotic cells.

Results: For this purpose, we generated isogenic chicken-cell populations expressing a fluorescent reporter integrated in one copy per clone. Although the clones differed only in the genetic locus at which the reporter was inserted, they showed markedly different fluorescence distributions, revealing different levels of stochastic gene expression. Use of chromatin-modifying agents showed that direct manipulation of chromatin dynamics had a marked effect on the extent of stochastic gene expression. To better understand the molecular mechanism involved in these phenomena, we fitted these data to a two-state model describing the opening/closing process of the chromatin. We found that the differences between clones seemed to be due mainly to the duration of the closed state, and that the agents we used mainly seem to act on the opening probability.

Conclusions: In this study, we report biological experiments combined with computational modeling, highlighting the importance of chromatin dynamics in stochastic gene expression. This work sheds a new light on the mechanisms of gene expression in higher eukaryotic cells, and argues in favor of relatively slow dynamics with long (hours to days) periods of quiet state.


Figures

Figure 1
Figure 1
Experimental strategy used for assessing the role of chromatin environment on stochastic gene expression. After generation of cellular clones expressing the fluorescent reporter mCherry, stably integrated as a unique copy into the genome, the fluorescence distributions obtained by flow cytometry ('FACS') were compared with simulated distributions generated by a two-state model ('Model'). After experimental determination and exploration of transcription-translation parameters (ρ, transcription rate; γ, translation rate; ρ˜, mRNA degradation rate; γ˜, protein degradation rate and α, protein fluorescence coefficient), the best parameter sets were identified, and then used to compute the specific chromatin dynamics (kon and koff, which are, respectively, the opening and closing transition rates of the chromatin at the reporter integration site) for each clone.
Figure 2
Figure 2
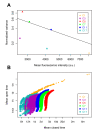
Exploration of model parameters to explain the observed stochastic gene expression for six cellular clones. (A) Relationship between normalized variance (NV) and mean fluorescence intensity (MFI) for six cellular clones (C1 to C17) stably transfected with a unique copy of the fluorescent reporter mCherry that was integrated at a different locus in each clone. Black line shows the relationship NV = 1/MFI. (B) Distributions of the possible chromatin dynamics. For each clone, all 1,087 possible couples of (1/kon; 1/koff) values were plotted, expressed as mean open time (1/koff) and mean closed time (1/kon) for all transcription-translation parameter sets explored analytically in the two-state model (see Methods). One dot therefore represents one possible analytical solution for that clone. h, hours; d, days; m, months.
Figure 3
Figure 3
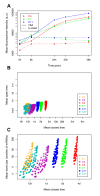
Exploration of model parameters based on treatments with chromatin-modifying agents. (A) Evolution of mean fluorescence intensity following kinetics of treatment with trichostatin A (TSA; solid line) and 5-azacytidine (5-AzaC; dotted line) (0 to 48 hours) for three cellular clones. (B) Distributions of the plausible chromatin dynamics. For each clone, all 114 possible couples of (1/kon; 1/koff) values were plotted, expressed as mean open time (1/koff) and mean closed time (1/kon), after removal of all parameter sets that were not able to account for the transcription-translation dynamics under TSA and 5-AzaC treatments. (C) This experiment was the same as for (B), except than the transcription rate (ρ) and the mean open time (1/koff) parameters were reduced to a single effective parameter (ρ/koff), representing the mean burst size. min, minutes; h, hours; d, days; m, months.
Figure 4
Figure 4
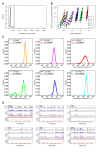
Exploration of model parameters based on a comparison of fluorescence distributions and stochastic simulation algorithm (SSA) simulations. (A) Distribution of parameter set scores. The lowest scores correspond to the better fits. These fits were obtained using values of γ and α, the parameters contained within the joint α·γ value of 0.035 arbitrary unit/min/mRNA. The upper limit (0.107) of the single peak showing the best scores is specified (vertical line). (B) Distribution of chromatin dynamics ('mean burst size' and 'mean closed time'), obtained for the best parameter sets, after distribution comparisons for the six cellular clones. To compare with the possible chromatin dynamics presented in Figure 3B, this figure shows the chromatin dynamics obtained for the best parameter sets (black; score means between 0.07 and 0.107; see panel (A)) and the optimal parameter set for each clone (brown). (C) Illustration, for the six cellular clones, of the comparison between the mCherry fluorescence distributions measured by flow cytometry ('FACS'; solid line), and simulated fluorescence distributions ('Modeled'; dotted line) obtained with the best chromatin-dynamics parameter set. (D) One run of Gillespie SSA per clone showing the chromatin dynamics (opening and closing chromatin events are shown in black) for one virtual cell of the isogenic population distribution (see panel (C)). Consequences of chromatin open/closed dynamics on mRNA transcription and protein translation are shown in blue and in red respectively. Production (+) and degradation (-) evolutions of mRNAs and proteins are also indicated. (For illustration, Figure S2 (see Additional file 3) shows the same analysis as that presented in this figure, but for the parameter set with the highest (that is, worst) comparison score among the best ones).
Figure 5
Figure 5
Inference of burst size and closed time from mean and normalized variance (NV) of protein levels. (A) At steady states, using the best transcription-translation parameter set (ρ, ρ˜, γ, γ˜ and α) and the modified Paulsson's equation system, the mean closed time could be calculated from the protein mean and protein NV (red grid). (B) Using the same data and equation system as in panel (A), the mean burst size could be calculated from the protein mean and protein normalized variance (red grid). Note that grids of both panels are linked because each value pair (protein mean and NV) corresponds to a single value pair (mean burst size and mean closed time). For both parts, clones C1, C3, C5, C7, C11, and C17 are represented as blue points on the grid, and all axes are on a logarithmic scale.
Figure 6
Figure 6
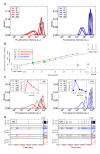
Model simulation of the perturbation of chromatin dynamics after trichostatin A (TSA) treatment. (A) Effects of TSA-treatment kinetics on the mCherry fluorescence distributions for two cellular clones, C5 (red) and C11 (blue) measured by flow cytometry. (B) New chromatin dynamics (mean burst size (ρ/koff) and mean closed time (1/kon)) fitting the observed fluorescence distribution evolution induced by TSA treatment. Different examples of these chromatin dynamics, inducing a higher open mean time (resulting from TSA treatment), are illustrated in the detailed view. After distribution-comparison tests, the best new chromatin dynamics (green), and those related to the steady state (brown) were ascertained. min, minutes; h, hours; d, days. (C) Simulated mCherry fluorescence distribution evolution obtained for the best new chromatin dynamics (see panel (B)). (Insets) Evolutions of the distribution-comparison scores (comparisons between measured distributions after TSA treatment and the simulated distributions). (D) One run of the Gillespie SSA per clone showing the dynamics of the chromatin before and during 48 hours of TSA treatment (opening and closing chromatin events are shown in black) for one virtual cell of the isogenic population distributions (see panel (C)). Consequences of chromatin open/closed dynamics on mRNA transcription and protein translation are shown in blue and in red respectively. Production (+) and degradation (-) evolutions of mRNAs and proteins are also shown. The beginning of TSA treatment is indicated by a vertical blue line. (For illustration, Figure S3 (see Additional file 5) shows the same analysis as presented in this figure but for a parameter set (same as used in Additional file 3, Figure S2) showing a weaker fit).

References

    1. Novick A, Weiner MC. Enzyme induction as an all-or-none phenomenon. Proc Natl Acad Sci USA. 1957;43:553–566. doi: 10.1073/pnas.43.7.553. - DOI - PMC - PubMed
    1. Spudich JL, Koshland DE Jr. Non-genetic individuality: chance in the single cell. Nature. 1976;262:467–471. doi: 10.1038/262467a0. - DOI - PubMed
    1. Kupiec JJ. A probabilistic theory for cell differentiation, embryonic mortality and DNA C-value paradox. Speculations in Science and Technology. 1983;6:471–478.
    1. Elowitz MB, Levine AJ, Siggia ED, Swain PS. Stochastic gene expression in a single cell. Science. 2002;297:1183–1186. doi: 10.1126/science.1070919. - DOI - PubMed
    1. Levsky JM, Shenoy SM, Pezo RC, Singer RH. Single-cell gene expression profiling. Science. 2002;297:836–840. doi: 10.1126/science.1072241. - DOI - PubMed

Publication types

MeSH terms

LinkOut - more resources