. 2013 Jan 22;104(2):300-12.
doi: 10.1016/j.bpj.2012.11.3835.

Modeling the flexural rigidity of rod photoreceptors

Affiliations

Modeling the flexural rigidity of rod photoreceptors

Mohammad Haeri et al. Biophys J. .

Abstract

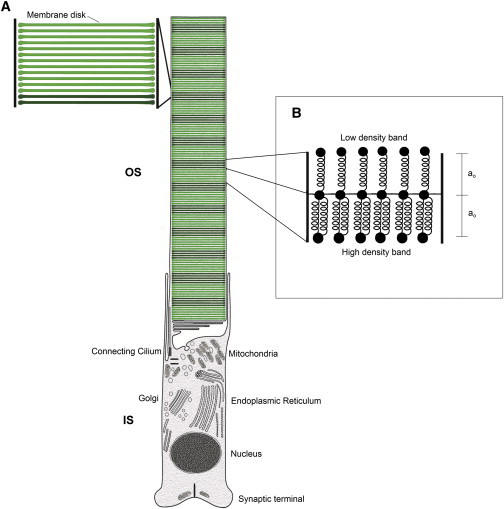
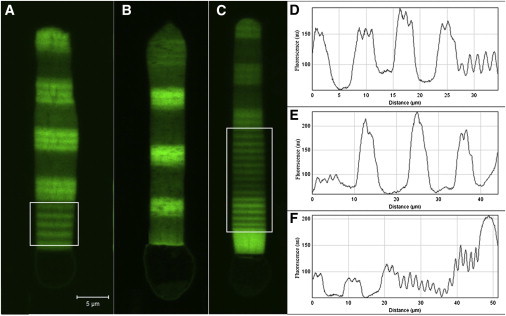
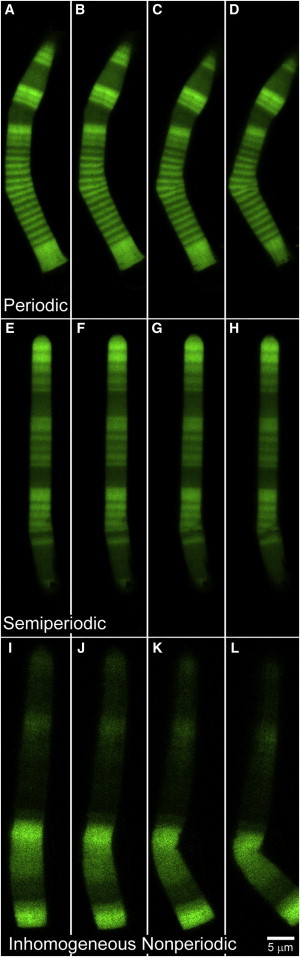
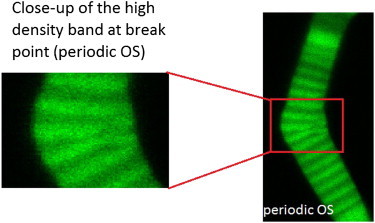
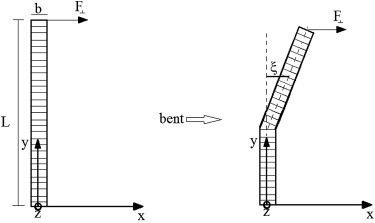
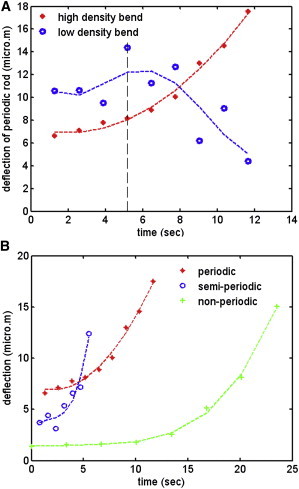
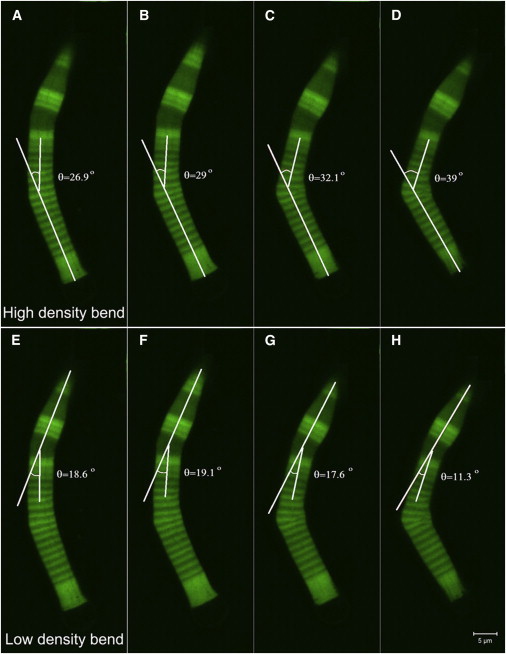
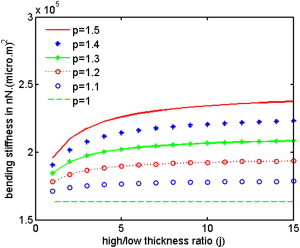
In vertebrate eyes, the rod photoreceptor has a modified cilium with an extended cylindrical structure specialized for phototransduction called the outer segment (OS). The OS has numerous stacked membrane disks and can bend or break when subjected to mechanical forces. The OS exhibits axial structural variation, with extended bands composed of a few hundred membrane disks whose thickness is diurnally modulated. Using high-resolution confocal microscopy, we have observed OS flexing and disruption in live transgenic Xenopus rods. Based on the experimental observations, we introduce a coarse-grained model of OS mechanical rigidity using elasticity theory, representing the axial OS banding explicitly via a spring-bead model. We calculate a bending stiffness of ∼10(5) nN⋅μm2, which is seven orders-of-magnitude larger than that of typical cilia and flagella. This bending stiffness has a quadratic relation to OS radius, so that thinner OS have lower fragility. Furthermore, we find that increasing the spatial frequency of axial OS banding decreases OS rigidity, reducing its fragility. Moreover, the model predicts a tendency for OS to break in bands with higher spring number density, analogous to the experimental observation that transgenic rods tended to break preferentially in bands of high fluorescence. We discuss how pathological alterations of disk membrane properties by mutant proteins may lead to increased OS rigidity and thus increased breakage, ultimately contributing to retinal degeneration.


Figures

Figure 1
Figure 1
(A) Illustration of the rod photoreceptor internal structure. The inner segment (IS) is the lower part with intracellular organelles. The outer segment (OS) is the top cylindrical part shown with the multilayered structure. Each horizontal line shows a lipid bilayer disk 6–8-nm thick (closeup shown on the left). The axial inhomogeneity observed under polarized light is shown as alternating dark and bright groups of membrane disks; each dark or bright group represents a density band, which contains between 100 and 300 lipid bilayer disks in an actual OS. (B) The spring-bead model for the OS density bands. The springs represent the density bands. Springs of equal length a0 and spring constant k connect the beads in neighboring bands. High-density bands have larger number of springs compared to low-density bands. Thicker density bands have j layers of springs, as discussed in the main text.
Figure 2
Figure 2
Banded structure of the OS. The thicknesses and densities of the bands depend on the amount of light received by the animal. (A–C) Show the OS with different periods of light/dark adaptation; (A) the upper part of the OS has bands of equal thickness which are formed in equal light/dark periods of three days each. These bands are thicker than the bands formed in the lower part of this OS (inside the white box); those are thin bands formed in 12 h/12 h light/dark cycle. The thin and dim bands that are within the upper thick bands in this OS are formed because the animal was not kept in absolute darkness. (B) Thick bands are formed in a period of three days dark and four days light. This picture shows thicker low-density bands which form in light-receiving periods. (C) The lower part of the OS (inside the white box) has bands which are formed in equal 12 h/12 h light/dark periods, where the bands are very thin and equal in thickness. The upper part of this OS has bands which have formed in seven-days dark-adapted animals. (D–F) Fluorescent intensity plots of the bands along the OS length; plot D corresponds to the rod shown in panel A, E corresponds to B, and F corresponds to C. These plots show the periodicity in the intensity of bands (depending on the light/dark cycle), and the increase of ∼1.3 in the fluorescent intensities of high-density bands compared to low-density bands. Scale bar is 5 μm.
Figure 3
Figure 3
Bending sequence of the OS. (A–D) A periodic OS formed in 12 h/12 h light/dark cycle. The bending in the OS increases from left to right until it breaks within a high-density band (closeup is shown in Fig. 4). Time between consecutive images is 2.6 s. (E–H) A semiperiodic OS formed in five days dark and two days light cycle. The bending and breakage of the OS is seen in consecutive images with time interval of 1.6 s. (I–L) An inhomogeneous nonperiodic OS bends and breaks from left to right. The breakage occurs within a high-density band. The time interval between consecutive images is 6.7 s. Scale bar is 5 μm.
Figure 4
Figure 4
Alteration of density bands are shown in a closeup picture of the broken band in the periodic OS of Fig. 3 (A–D). The internal structure of the high-density band is altered in the orthogonal direction to bend.
Figure 5
Figure 5
Schematic of an OS and its banded structure. The OS is fixed at its lower end. Upon exertion of a transverse force F to its free-end, it bends and the deflection ξ is measured in the direction of bend with respect to the reference line (dotted line in y direction).
Figure 6
Figure 6
Deflection curves for OS with different types of internal structure. (A) A periodic OS with L = 59.3 μm, b = 4.15 μm. This OS has two bends—one in the high-density band (dots) and one in the low-density band (circles). (Vertical dashed line) Point of break, after which the low-density bend recovers while the high-density bend leads to a breakage. (B) The high-density bend of the periodic OS (dots), a semiperiodic OS bending in a high-density band (circles) with L = 60.9 μm, b = 5.58 μm, and an inhomogeneous nonperiodic OS bending in a high-density band (stars) with L = 58.2 μm, b = 6.17 μm.
Figure 7
Figure 7
Bending angles in a bent OS. The time interval between consecutive images is 2.6 s. (A–D) Bend in a high density region with a periodic structure. (E–H) Bend in a low-density region with a semiperiodic structure. The angles are measured with respect to the stationary lower and upper ends of the OS in each case. In each set of images, the bending increases from left to right, with the high-density region showing a larger bend under stress. Finally the internal structure of the OS gets distorted within a high-density band, and the OS breaks at that point. The bending in the low-density band recovers and no breaking is observed in that band. Scale bar is 5 μm (see Movie S1 in the Supporting Material).
Figure 8
Figure 8
Bending stiffness, kb, as a function of the parameter j representing the ratio of high/low-density band thicknesses, for different density ratios p. An increase in j means thicker high-density bands compared to low-density bands. The bending stiffness increases with the density ratio p.
Figure 9
Figure 9
Force-versus-deflection curves for OS with different internal structures. The scales are different on the vertical axes. (A) A periodic OS with L = 59.3 μm, b = 4.15 μm, and calculated kb = 1.03 × 105 nN⋅μm2. (B) A semiperiodic OS bending in a high-density band with L = 60.9 μm, b = 5.58 μm, and calculated kb = 2.13 × 105 nN.μm2. (C) An inhomogeneous nonperiodic OS bending in a high-density region with L = 58.2 μm, b = 6.17 μm, and calculated kb = 3.33 × 105 nN⋅μm2. The values of the critical forces in each case are shown in the plots.

Comment in

Similar articles

Cited by

References

    1. Dowling J.E. Belknap Press/Harvard University Press; Cambridge, MA: 1987. The Retina: An Approachable Part of the Brain. 12–42.
    1. Hood D.C., Lin C.E., Birch D.G. Thickness of receptor and post-receptor retinal layers in patients with retinitis pigmentosa measured with frequency-domain optical coherence tomography. Invest. Ophthalmol. Vis. Sci. 2009;50:2328–2336. - PMC - PubMed
    1. Pugh E.N., Jr., Lamb T.D. Phototransduction in vertebrate rods and cones: molecular mechanisms of amplification, recovery and light adaptation. In: Stavenga D.G., de Grip W.J., Pugh E.N. Jr., editors. Handbook of Biological Physics. Elsevier; Amsterdam: 2000. pp. 183–254.
    1. Basinger S., Bok D., Hall M. Rhodopsin in the rod outer segment plasma membrane. J. Cell Biol. 1976;69:29–42. - PMC - PubMed
    1. Papermaster D.S., Dreyer W.J. Rhodopsin content in the outer segment membranes of bovine and frog retinal rods. Biochemistry. 1974;13:2438–2444. - PubMed

Publication types

MeSH terms

LinkOut - more resources