. 2013 Jan 22;104(2):332-43.
doi: 10.1016/j.bpj.2012.11.3808.

Integrating mitochondrial energetics, redox and ROS metabolic networks: a two-compartment model

Affiliations

Integrating mitochondrial energetics, redox and ROS metabolic networks: a two-compartment model

Jackelyn M Kembro et al. Biophys J. .

Abstract

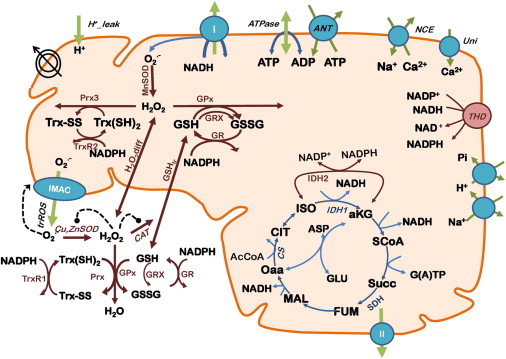
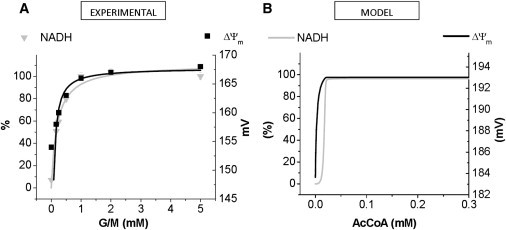
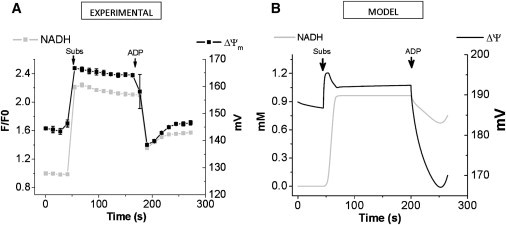
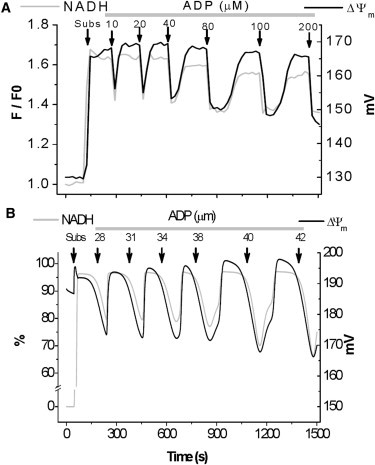
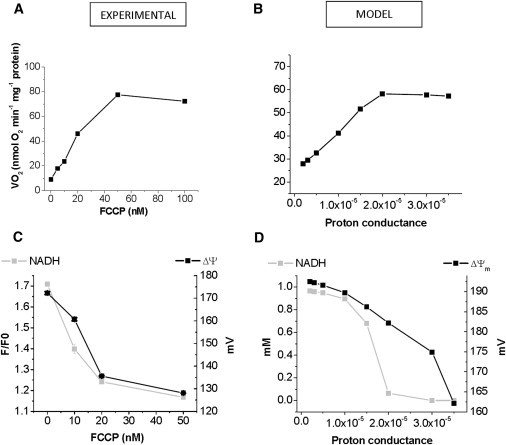
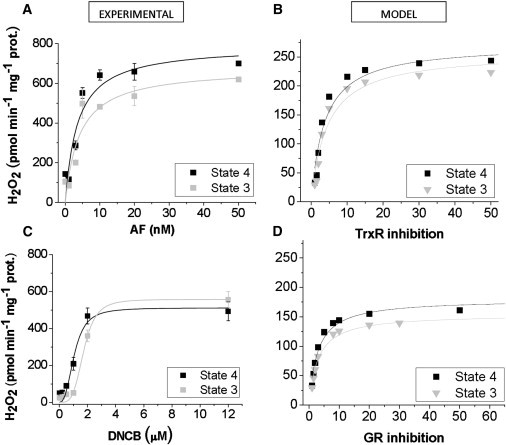
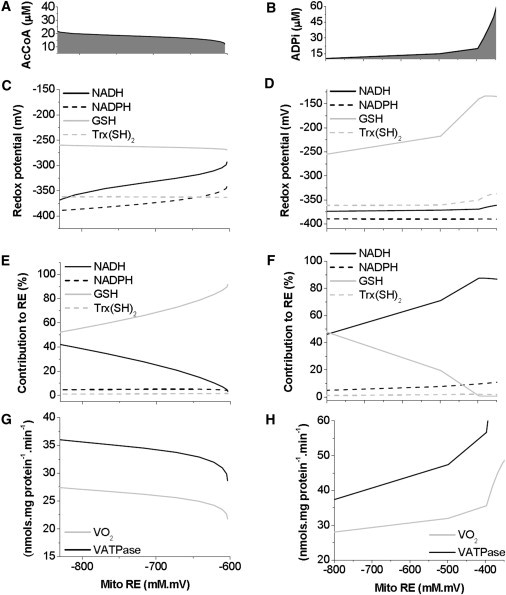
To understand the mechanisms involved in the control and regulation of mitochondrial reactive oxygen species (ROS) levels, a two-compartment computational mitochondrial energetic-redox (ME-R) model accounting for energetic, redox, and ROS metabolisms is presented. The ME-R model incorporates four main redox couples (NADH/NAD(+), NADPH/NADP(+), GSH/GSSG, Trx(SH)(2)/TrxSS). Scavenging systems-glutathione, thioredoxin, superoxide dismutase, catalase-are distributed in mitochondrial matrix and extra-matrix compartments, and transport between compartments of ROS species (superoxide: O(2)(⋅-), hydrogen peroxide: H(2)O(2)), and GSH is also taken into account. Model simulations are compared with experimental data obtained from isolated heart mitochondria. The ME-R model is able to simulate: i), the shape and order of magnitude of H(2)O(2) emission and dose-response kinetics observed after treatment with inhibitors of the GSH or Trx scavenging systems and ii), steady and transient behavior of ΔΨ(m) and NADH after single or repetitive pulses of substrate- or uncoupler-elicited energetic-redox transitions. The dynamics of the redox environment in both compartments is analyzed with the model following substrate addition. The ME-R model represents a useful computational tool for exploring ROS dynamics, the role of compartmentation in the modulation of the redox environment, and how redox regulation participates in the control of mitochondrial function.


Figures

Figure 1
Figure 1
Scheme of the two-compartment ME-R model accounting for mitochondrial energetic and redox processes, their interactions, and transport between compartments. The model takes into account OxPhos and matrix-based processes in mitochondria (26,44) as well as in the extra-matrix compartment. In addition to energy metabolism and ion transport (H+, Ca2+, Na+, Pi) the model accounts for O2⋅− being produced in the mitochondrial electron transport chain from both complex I- and complex II-derived electron transport. O2⋅− may be dismutated to H2O2 by superoxide dismutase (MnSOD) in the matrix or be transported as such to the extra-matrix compartment through the inner membrane anion channel, where it will be scavenged by Cu,ZnSOD generating H2O2. In the mitochondrial matrix, H2O2 can either diffuse outside or be scavenged by the large capacity GSH and Trx systems. In the extra-matrix compartment H2O2 may be additionally scavenged by catalase (CAT). Grx accounts for the recovery of glutathionylated proteins in the matrix. Key to symbols: Concentric circles with an arrow across represent the ΔΨm. Dotted arrows indicate regulatory interactions either positive (arrowhead) or negative (●−). (Shunt) indicates the fraction of electrons from respiration diverging toward O2⋅−. Not indicated in the scheme is the shunt from complex II respiratory substrates.
Figure 2
Figure 2
Comparison of experimental results with model simulations of NADH and ΔΨm as a function of substrate concentration. (A) Experimentally observed substrate G/M dose-response behavior of NADH (inverted gray triangle) and ΔΨm (black solid square) in isolated heart mitochondria. Data points correspond to the mean ± SE (n = 3, three independent experiments). (B) Steady-state behavior of NADH concentration (gray trace) and ΔΨm (black trace) in the ME-R model as a function of substrate concentration (represented by AcCoA in the model): from 1 × 10−6 to 0.3 mM, that emulates the experimental protocol. Model simulations were run with the following parameter values at a fixed value: ADPi = 0.01 mM (state 4), Shunt = 0.008 and glutamate = 1 × 10−6 mM.
Figure 3
Figure 3
Comparison of experimental results with model simulations of NADH and ΔΨm dynamics during transitions between states 4 and 3. (A) Experimental profiles of NADH (gray solid square) and ΔΨm (black solid square) after addition of 5 mM G/M (Subs), and 1 mM ADP to guinea pig heart mitochondria, as indicated by arrows. Experimental data at each time point corresponds to the mean ± SE (n = 3). (B) Model simulations were performed by varying the parameters detailed below to emulate the experimental protocol applied in panel A. The addition of substrate was mimicked by a parametric increase in AcCoA and glutamate (Subs) from 1 × 10−5 to 0.1, and from 1 × 10−5 to 30, respectively. A basal extra-matrix ADP concentration (ADPi) of 0.01 mM was used until the state 4→3 transition in which ADPi = 0.03 mM was applied.
Figure 4
Figure 4
Comparison of experimental results with model simulations of NADH and ΔΨm dynamics in response to the addition of consecutive ADP pulses. (A) Depicted are the experimentally determined temporal profiles of NADH (gray trace) and ΔΨm (black trace) following the addition of consecutively increasing concentrations of ADP to isolated guinea pig heart mitochondria. Shown is a representative trace from at least three independent experiments. The first arrow indicates addition of substrate (Subs, 5 mM G/M). (B) Model simulation of the experimental time courses shown in panel A. Sequential addition of ADP was simulated by pulses of increasing concentration of cytoplasmic ADP, ADPi. Arrows point to substrate (Subs) and ADP additions (see also legend Fig. 3).
Figure 5
Figure 5
Steady-state behavior of respiration, NADH, and ΔΨm as a function of mitochondrial membrane uncoupling. Freshly isolated guinea pig heart mitochondria were subjected up to 100 nM FCCP, an uncoupler of mitochondrial respiration. Respiration (A) and NADH, ΔΨm (C) were evaluated as described in the Materials and Methods. To simulate the experimental protocol shown in panel A, the proton conductance (gh) in the ME-R model was increased from 2 × 10−6 to 3.5 × 10−5 mM ms−1 mV−1. Under these conditions, the steady-state values of respiration (VO2) from both complex I and II (B), and NADH and ΔΨm (D) are represented.
Figure 6
Figure 6
Effect of selective inhibition of Trx or GSH scavenging systems on H2O2 emission from heart mitochondria during respiratory states 4 and 3. Freshly isolated mitochondria (∼100 μg mitochondrial protein) from guinea pig hearts were preincubated with the indicated concentrations of AF (A), or DNCB (C) in the presence of G/M (5 mM each). Monitoring of H2O2 was performed with the Amplex Red assay during state 4 (black solid square) and 3 (+1 mM ADP, gray solid square) respiration (see Materials and Methods). Shown are the specific fluxes of H2O2 emission obtained from two experiments with duplicates in each (24). For simulating AF inhibition with the ME-R model, the concentrations of Trx reductase from mitochondrial (Etrxm) and extra-matrix (Etrx) compartments were simultaneously lowered from a control concentration of 3.5 × 10−4 mM to 7 × 10−6 mM. The steady state values of H2O2 emission (VH2O2dif expressed in the same units as the experimental plots) were computed at each inhibitory concentration (B). DNCB inhibition was simulated by simultaneously decreasing mitochondrial (EtGRm) and extra-matrix (EtGR) GR from a control concentration of 9 × 10−4 mM to 3 × 10−5 mM. In the simulations, the percent inhibition was calculated from dividing the control concentration by EtGRm and the result multiplied by 100. In experiments and simulations, the kinetic parameters (Vmax and K0.5) that characterize the H2O2 emission fluxes as a function of the inhibitor concentrations, were determined by nonlinear regression of the data points with a hyperbolic Michaelis-Menten or Hill type equation (solid lines).
Figure 7
Figure 7
Relationship between redox couples and mitochondrial RE at different concentrations of extra-matrix substrates. Steady-state values were obtained at increasing concentrations of AcCoA: 0.012–0.024 mM (A,C,E,G) or ADPi: 0.01–0.05 mM (B,D,F,H). (A and D) Redox potential of each mitochondrial redox pair was estimated and represented as a function of the mitochondrial RE (Eq. S3). (E and F) The relative contribution of each mitochondrial redox couple to the RE was estimated (= (Ei[reduced species]i100)/mitochondrial RE) and represented as a function of the mitochondrial RE. Standard redox potentials used were −320 mV for NADH/NAD+; −324 mV for NADPH/NADP+ (64) −292 mV for Trx(SH)2/TrxSS, and −240 mV for 2 GSH/GSSG, −160 mV (41,42). (G and H) Steady-state respiration (VO2) from complex I and II and rate of ATP synthesis (VATPase) are depicted.

References

    1. Silverthorn D.U., Ober W.C., Johnson B.R. Pearson Benjamin Cummings; San Francisco, CA: 2009. Human Physiology: An Integrated Approach.
    1. Weibel E.R., Hoppeler H. Exercise-induced maximal metabolic rate scales with muscle aerobic capacity. J. Exp. Biol. 2005;208:1635–1644. - PubMed
    1. Rolfe D.F., Brown G.C. Cellular energy utilization and molecular origin of standard metabolic rate in mammals. Physiol. Rev. 1997;77:731–758. - PubMed
    1. Balaban R.S., Nemoto S., Finkel T. Mitochondria, oxidants, and aging. Cell. 2005;120:483–495. - PubMed
    1. Chance B., Sies H., Boveris A. Hydroperoxide metabolism in mammalian organs. Physiol. Rev. 1979;59:527–605. - PubMed

Publication types

MeSH terms

LinkOut - more resources