. 2013 Jan 22;104(2):488-95.
doi: 10.1016/j.bpj.2012.12.012.

Inherent relationships among different biophysical prediction methods for intrinsically disordered proteins

Affiliations

Inherent relationships among different biophysical prediction methods for intrinsically disordered proteins

Fan Jin et al. Biophys J. .

Abstract

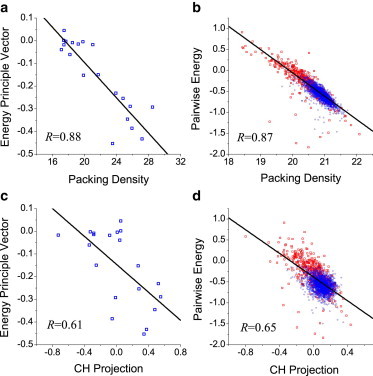
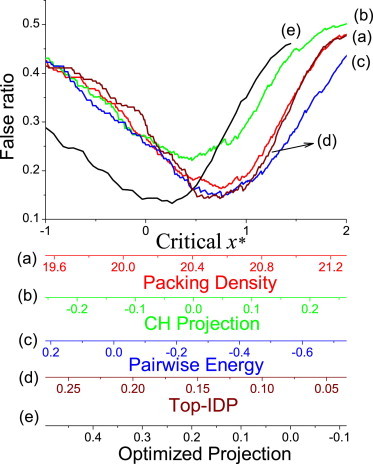
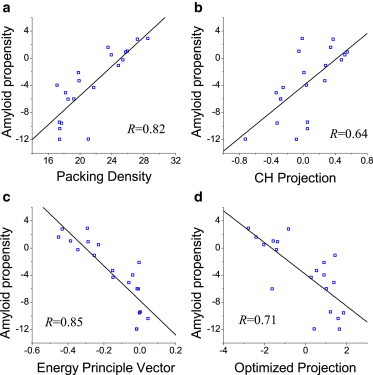
Intrinsically disordered proteins do not have stable secondary and/or tertiary structures but still function. More than 50 prediction methods have been developed and inherent relationships may be expected to exist among them. To investigate this, we conducted molecular simulations and algorithmic analyses on a minimal coarse-grained polypeptide model and discovered a common basis for the charge-hydropathy plot and packing-density algorithms that was verified by correlation analysis. The correlation analysis approach was applied to realistic datasets, which revealed correlations among some physical-chemical properties (charge-hydropathy plot, packing density, pairwise energy). The correlations indicated that these biophysical methods find a projected direction to discriminate ordered and disordered proteins. The optimized projection was determined and the ultimate accuracy limit of the existing algorithms is discussed.


Figures

Figure 1
Figure 1
Average radius of gyration (〈Rg〉) of HPQ chains with sequence length N = 150 as a function of the hydrophobic-residue fraction (〈H〉) when the charged-residue fraction is: (from bottom to top) 〈Q〉 = 0.0, 0.1, 0.2, …, 0.9. (Points) Simulation results averaged over five random sequences. (Lines) Fit of the simulation results as given by Eqs. 1 and 2.
Figure 2
Figure 2
Performance of the CH-plot and packing-density algorithms on the HPQ model. The ordered and disordered datasets are shown (circles and rectangles), respectively. (a) Performance of the CH-plot with the determined boundary shown (solid line). (b) Performance of the packing-density algorithm: (open symbols) the successful predictions; (solid symbols) the false predictions. The optimized window size was 55 and the critical packing-density value was 52.8.
Figure 3
Figure 3
Relationships between the CH-plot and packing-density algorithms in the HPQ model. (a) The CH-plot boundary (red) and the packing-density contour (blue) in the (〈H〉, 〈Q〉) plane. (Thick line) Contour line with the critical packing-density value. (Arrows) Normal-lines normal to the boundaries in the CH-plot and packing-density algorithms. (b and c) Correlations between the packing density and the CH-plot projection (b) for three residues and (c) at the polypeptide level.
Figure 4
Figure 4
Correlations between the CH-plot and packing-density algorithms in real systems. (a) Correlation at the 20-residue level. (b) Correlation at the protein level in the SCOP (blue circles) and DisProt (red rectangles) datasets. (Straight lines) Linear fits of data; the correlation coefficients are also shown. To reduce the overwhelming number of SCOP data points, the same numbers of SCOP and DisProt data points were used in the global linear fit.
Figure 5
Figure 5
Relationships between the pairwise-energy algorithm and other algorithms. (a and b) Correlation between the pairwise-energy and packing-density algorithms. (c and d) Correlation between the pairwise-energy and CH-plot algorithms. The first principle component of the pairwise-energy matrix was used in the analysis at the residue level (a and c). SCOP and DisProt datasets (blue circles and red rectangles), respectively (b and d).
Figure 6
Figure 6
Performance of various physico-chemical properties in order/disorder prediction. Scales for five properties are shown at the bottom of the figure. The properties (denoted as x) were also normalized into a comparable scale (x) using the mean value (〈x〉) and the distribution width (σx) of the positive (disordered) set: x = (x – 〈x〉)/σx, which was adopted in aligning different cures.
Figure 7
Figure 7
Correlations between the amyloid propensity and various physico-chemical properties used in order/disorder prediction.

Similar articles

Cited by

References

    1. Uversky V.N. Natively unfolded proteins: a point where biology waits for physics. Protein Sci. 2002;11:739–756. - PMC - PubMed
    1. Dunker A.K., Brown C.J., Obradović Z. Intrinsic disorder and protein function. Biochemistry. 2002;41:6573–6582. - PubMed
    1. Wright P.E., Dyson H.J. Intrinsically unstructured proteins: re-assessing the protein structure-function paradigm. J. Mol. Biol. 1999;293:321–331. - PubMed
    1. Huang Y., Liu Z. Intrinsically disordered proteins: the new sequence-structure-function relations. Acta Phys. Chim. Sin. 2010;26:2061–2072.
    1. Fuxreiter M., Tompa P., Asturias F.J. Malleable machines take shape in eukaryotic transcriptional regulation. Nat. Chem. Biol. 2008;4:728–737. - PMC - PubMed

Publication types

LinkOut - more resources