

doi: 10.1016/j.bpj.2012.12.039.
Simple moment-closure model for the self-assembly of breakable amyloid filaments
Affiliations
- PMID: 23442904
- PMCID: PMC3566462
- DOI: 10.1016/j.bpj.2012.12.039
Item in Clipboard
Simple moment-closure model for the self-assembly of breakable amyloid filaments
Biophys J.
.
Abstract
In this work, we derive a simple mathematical model from mass-action equations for amyloid fiber formation that takes into account the primary nucleation, elongation, and length-dependent fragmentation. The derivation is based on the principle of minimum free energy under certain constraints and is mathematically related to the partial equilibrium approximation. Direct numerical comparisons confirm the usefulness of our simple model. We further explore its basic kinetic and equilibrium properties, and show that the current model is a straightforward generalization of that with constant fragmentation rates.
Copyright © 2013 Biophysical Society. Published by Elsevier Inc. All rights reserved.
Figures
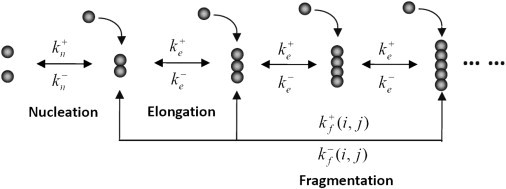
Illustration of primary nucleation, elongation, and fragmentation processes in the formation of breakable amyloid filaments.
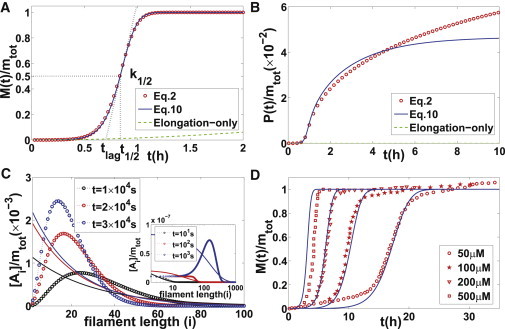
(A and B) Comparisons of mass-action Eq. 2 (red circles), elongation-only model (green dashed lines), and moment-closure Eq. 10 (blue solid lines) in the calculation of and with , , , , , , , . Three major kinetic quantities are represented by black dotted lines. (To highlight the significant roles of fragmentation, we plot the results of the elongation-only model (38,39) (by simply neglecting the fragmentation process ) for comparison. It can be clearly seen that the elongation-only model is only applicable to the very initial stage, in correspondence with the fact that elongation is much faster than fragmentation. Actually, when the long-time behaviors are concerned, the slow processes (fragmentation in this case) play a major role. This is expected mathematically. From a biological point of view, fragmentation can provide more fiber seeds (even their reaction rate constants look very small compared with other processes), which will greatly affect the formation of amyloid fiber.) (C) Comparison of exact fiber length distribution (calculated from Eq. 2 and shown by dots) and approximate fiber length distribution (obtained in Eq. 7 and shown by solid lines) at different time. (D) Experimental data fitting for polymerization of the WW domain measured by Ferguson et al. (44). Red circles indicate experimental data under different initial protein concentrations , respectively; blue solid lines indicate numerical solutions of moment-closure equations (Eq. 11) with , , , , , , . (Knowles et al. (8) performed a similar fitting for models with length-independent fragmentation. However, their reaction rate constant for fragmentation appears to be much larger than ours due to their oversimplified assumption of length dependence.)
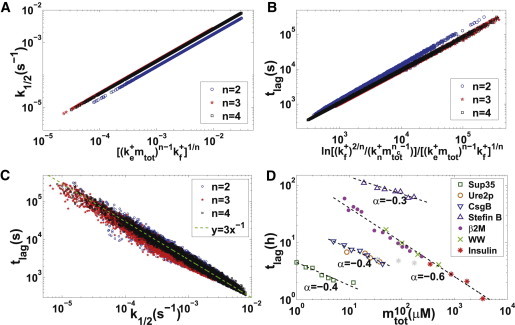
(A–C) Scaling relationships among apparent fiber growth rate, lag time, and model parameters. For parameter , 10,000 data points are generated separately with reaction rate constants randomly chosen in , , , for , for , for , , . (D) Scaling relationship between lag time and protein concentration (). Data are shown for Sup35 NW region (dark green squares) (14), Ure2p (brown circles) (48), CsgBtrunc (blue downward triangles) (49), Stefin B (purple upward triangles) (50), β2-microglobulin (pink dots) (51), WW domain (light green crosses) (44), and insulin (red stars) (52). Black dashed lines denote the best fitting curves for each data set, with the slope numbered beside the line. For scaling exponents , the corresponding model parameters are , respectively.
Similar articles
-
A Kinetic Model for Cell Damage Caused by Oligomer Formation.Biophys J. 2015 Oct 6;109(7):1338-46. doi: 10.1016/j.bpj.2015.08.007. Biophys J. 2015. PMID: 26445435 Free PMC article.
-
The role of prefibrillar structures in the assembly of a peptide amyloid.J Mol Biol. 2009 Oct 16;393(1):214-26. doi: 10.1016/j.jmb.2009.06.026. Epub 2009 Jun 12. J Mol Biol. 2009. PMID: 19524594
-
An analytical solution to the kinetics of breakable filament assembly.Science. 2009 Dec 11;326(5959):1533-7. doi: 10.1126/science.1178250. Science. 2009. PMID: 20007899
-
Fitting neurological protein aggregation kinetic data via a 2-step, minimal/"Ockham's razor" model: the Finke-Watzky mechanism of nucleation followed by autocatalytic surface growth.Biochemistry. 2008 Feb 26;47(8):2413-27. doi: 10.1021/bi701899y. Epub 2008 Feb 5. Biochemistry. 2008. PMID: 18247636 Review.
-
Modelling amyloid fibril formation kinetics: mechanisms of nucleation and growth.J Phys Condens Matter. 2013 Sep 18;25(37):373101. doi: 10.1088/0953-8984/25/37/373101. Epub 2013 Aug 14. J Phys Condens Matter. 2013. PMID: 23941964 Review.
Cited by
-
Protein Polymerization into Fibrils from the Viewpoint of Nucleation Theory.Biophys J. 2015 Nov 17;109(10):2126-36. doi: 10.1016/j.bpj.2015.10.010. Biophys J. 2015. PMID: 26588571 Free PMC article.
-
Measurement of Tau Filament Fragmentation Provides Insights into Prion-like Spreading.ACS Chem Neurosci. 2018 Jun 20;9(6):1276-1282. doi: 10.1021/acschemneuro.8b00094. Epub 2018 Apr 8. ACS Chem Neurosci. 2018. PMID: 29590529 Free PMC article.
-
Single-Molecular Heteroamyloidosis of Human Islet Amyloid Polypeptide.Nano Lett. 2019 Sep 11;19(9):6535-6546. doi: 10.1021/acs.nanolett.9b02771. Epub 2019 Aug 29. Nano Lett. 2019. PMID: 31455083 Free PMC article.
-
A Kinetic Model for Cell Damage Caused by Oligomer Formation.Biophys J. 2015 Oct 6;109(7):1338-46. doi: 10.1016/j.bpj.2015.08.007. Biophys J. 2015. PMID: 26445435 Free PMC article.
-
Statistical mechanical treatments of protein amyloid formation.Int J Mol Sci. 2013 Aug 23;14(9):17420-52. doi: 10.3390/ijms140917420. Int J Mol Sci. 2013. PMID: 23979423 Free PMC article. Review.
References
-
- Prusiner S.B. Molecular biology of prion diseases. Science. 1991;252:1515–1522. - PubMed
-
- Dobson C.M. Protein folding and misfolding. Nature. 2003;426:884–890. - PubMed
-
- Ghahghaei A., Faridi N. Structure of amyloid fibril in diseases. J. Biomed. Sci. Eng. 2009;2:345–358.
-
- Morris A.M., Watzky M.A., Finke R.G. Protein aggregation kinetics, mechanism, and curve-fitting: a review of the literature. Biochim. Biophys. Acta. 2009;1794:375–397. - PubMed
-
- Chiti F., Dobson C.M. Protein misfolding, functional amyloid, and human disease. Annu. Rev. Biochem. 2006;75:333–366. - PubMed
Publication types
MeSH terms
Substances
LinkOut - more resources
Full Text Sources
Other Literature Sources
