. 2013 Feb 19;104(4):770-7.
doi: 10.1016/j.bpj.2012.12.053.

Live-cell superresolution imaging by pulsed STED two-photon excitation microscopy

Affiliations

Live-cell superresolution imaging by pulsed STED two-photon excitation microscopy

Kevin T Takasaki et al. Biophys J. .

Abstract

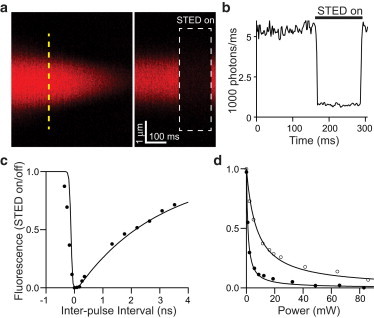
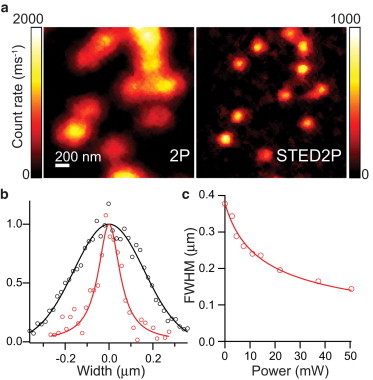
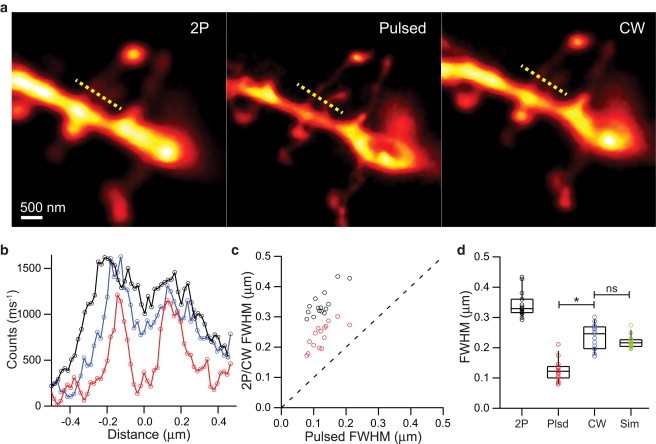
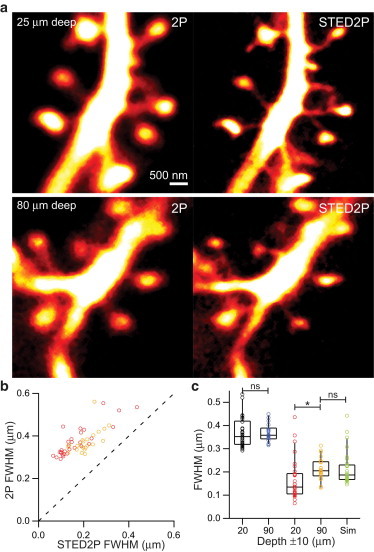
Two-photon laser scanning microscopy (2PLSM) allows fluorescence imaging in thick biological samples where absorption and scattering typically degrade resolution and signal collection of one-photon imaging approaches. The spatial resolution of conventional 2PLSM is limited by diffraction, and the near-infrared wavelengths used for excitation in 2PLSM preclude the accurate imaging of many small subcellular compartments of neurons. Stimulated emission depletion (STED) microscopy is a superresolution imaging modality that overcomes the resolution limit imposed by diffraction and allows fluorescence imaging of nanoscale features. Here, we describe the design and operation of a superresolution two-photon microscope using pulsed excitation and STED lasers. We examine the depth dependence of STED imaging in acute tissue slices and find enhancement of 2P resolution ranging from approximately fivefold at 20 μm to approximately twofold at 90-μm deep. The depth dependence of resolution is found to be consistent with the depth dependence of depletion efficiency, suggesting resolution is limited by STED laser propagation through turbid tissue. Finally, we achieve live imaging of dendritic spines with 60-nm resolution and demonstrate that our technique allows accurate quantification of neuronal morphology up to 30-μm deep in living brain tissue.


Figures

Figure 1
Figure 1
Design of pulsed STED 2PLSM microscope. Laser pulses from a femtosecond-pulsed Ti-Sapphire laser (Excitation) for two-photon excitation (2PE) are synchronized by an electronic feedback circuit (Synchrolock) with a picosecond-pulsed Ti-Sapphire laser (STED) for stimulated emission. STED pulses are stretched to ∼200 ps by dispersion through a 120-m single-mode polarization-maintaining fiber-optic (FO), and phase-patterned to achieve a helical wavefront by a vortex phase plate (VP). The 2PE and STED lasers are combined by a dichroic (D1) filter. Fluorescence is separated from excitation and depletion light by a dichroic (D2) filter and collected by photomultiplier tubes (PMT). The λ/2 and λ/4 elements are half- and quarter-waveplates used to adjust the polarization and compensate for downstream elements in the scan head, such as dichroics filters, that perturb the polarizations of the excitation and depletion light (SL, scan lens; TL, tube lens; SM, scanning mirror; Obj, objective). (Inset) Visual alignment of 2PE and STED foci by fluorescence imaging of quantum dots (Qdot605; Invitrogen). Composite imaging of the 2PE point-spread function (PSF) and STED PSF allows spatial coalignment in the XY (left) and XZ (right) planes.
Figure 2
Figure 2
Efficacy of pulsed depletion of 2P excited fluorophores. (a) 2PLSM image (λexc = 810 nm) of sealed glass pipette containing a solution of the red fluorophore Alexa Fluor-594 (left) and fluorescence collected in linescan mode (right, along dashed line). During the time indicated (boxed white region), the pulsed STED laser light was delivered (λsted = 736 nm), suppressing fluorescence. For these experiments, the vortex phase plate was withdrawn from the STED path to deplete the entire excitation volume. (b) Fluorescence in the pipette measured in linescan (see panel a) before, during, and after pSTED illumination, demonstrating reversible suppression of fluorescence. (c) Fluorescence depletion efficiency, quantified as the ratio of fluorescence with and without pSTED illumination plotted against the relative timing delay between excitation and STED pulses. Depletion efficiency versus relative timing was numerically simulated for a 200-ps STED pulse (solid line). (d) Depletion efficiency versus STED laser power for pulsed (solid circles) and continuous wave (open circles) depletion modes. Data points were fit to rectangular hyperbolas to determine the power producing 50% depletion (Psat).
Figure 3
Figure 3
Pulsed STED2P imaging of red fluorescent beads. (a) Images of 40-nm red fluorescent beads with conventional 2PLSM (left) and pulsed STED 2PLSM (right). (b) Line profile of bead fluorescence measured across an isolated bead in panel a by 2PLSM (black markers) and pSTED 2PLSM (red markers). 2P data were fit by a Gaussian (FWHM = 377 nm) and pSTED2P data were fit by a Lorentzian (FWHM = 144 nm). (c) FWHM of pSTED2P images of isolated beads plotted against STED power. Bead profiles were fit with Gaussian and Lorentzian functions, and the FWHM was determined from the function producing the best fit. Data points were fitted to the inverse square-root function in Eq. 1 (solid line).
Figure 4
Figure 4
Comparison of pulsed and CW STED2P imaging in tissue. (a) Images of a spiny dendrite taken with 2PLSM (left), pulsed STED 2PLSM (middle), and CW STED 2PLSM (right). (b) Line profiles of closely spaced spine necks (along the dashed yellow lines) in panel a taken by 2PLSM (black), CW STED2P (blue), and pSTED2P (red). Background counts have been subtracted and baselined for display. (c) Distribution of apparent widths of spine necks (n = 15) as measured by 2PLSM (black markers) and CW STED2P (red markers) compared with measurements by pSTED2P. (Dashed line) Unity. (d) Neck widths measured by 2PLSM (2P), pSTED2P (Plsd), and CW STED2P (CW), and simulated widths (Sim) derived from pSTED2P measurements convolved with 170 nm PSF. , P < 0.05; ns, not significant (Mann-Whitney rank sum test).
Figure 5
Figure 5
Depth dependence of resolution in acute brain slices. (a) Images of spiny dendrites taken with 2PLSM (left column) and pulsed STED2P (right column) imaged at 25-μm deep (top row) and 80-μm deep (bottom row). (b) Distribution of apparent widths of spine necks as measured by 2PLSM compared with measurements by pSTED2P 10–30 μm deep (n = 29, red markers) and 80–100 μm deep (n = 21, yellow markers). (Dashed line) Unity. (c) Neck widths measured by 2PLSM shallow (black markers) and deep (blue markers), and by pSTED2P shallow (red markers) and deep (yellow markers). , P < 0.05; ns, not significant (Mann-Whitney rank sum test).
Figure 6
Figure 6
Tissue penetration of depletion in acute brain slices. (a) 2PLSM image of spiny dendrite (left) and fluorescence collected in linescan mode (right, along the dashed line). pSTED light was simultaneously applied during the time period indicated (white dashed box). The vortex phase plate was withdrawn from the pSTED path to deplete the entire excitation volume. (b) Fluorescence averaged across the dendrite measured in linescan in panel a and normalized to the period before pSTED illumination. (c) Depletion efficiency versus pSTED laser power measured at 20 (red), 70 (yellow), 110 (blue), and 140 (black) μm deep. Data points were fit to rectangular hyperbolas to determine Psat. (d) Psat versus depth in slice. Data points were fit to an exponential to determine a surface constant (Psat(0) = 0.55 mW) and length constant (λ = 45 μm). (e) Theoretical improvement in resolution versus depth in slice derived from Eq. 1 for 52 mW STED power and modeled with a depth-dependent Psat determined from the fit in panel d. The width ratio of the five smallest necks from Fig. 5 shallow (red markers) and deep (yellow markers) groups are superimposed on the theoretical curve with mean ± SE values (black markers).
Figure 7
Figure 7
Imaging with 60-nm resolution in acute brain slices. (a) Images of a spiny dendrite taken with 2PLSM (left) and pulsed STED 2PLSM (right) 16 μm below the tissue surface. Note that spinules emerging from the heads of spines are visualized in the pSTED2P but not in the 2P image. (b) Line profiles of a thin spine neck (along the dashed yellow lines) in panel a taken by 2PLSM (black circles) and pSTED2P (red circles). The data were fitted with a Gaussian of 328 nm FWHM (black line) and a Lorentzian of 68 nm FWHM (red line). (c) Distribution of apparent widths of spine necks (n = 67) as measured by 2PLSM compared with measurements by pSTED2P. The widths of larger, well-isolated features such as spine heads and dendrites were also measured (blue circles). Simulated measurements (black line) of model data are plotted for 2PLSM and pSTED2P resolutions of 300 nm and 60 nm, respectively. (Dashed line) Unity. (d) Distribution of spine neck radii inferred from total fluorescence (see Materials and Methods) versus radii measured by pSTED2P. (Dashed line) Unity. (e) Distributions of spine neck radii (Rn), neck lengths (Ln), and head volumes (Vh) measured by pSTED2P.

Comment in

  • Superresolving dendritic spines.
    Loew LM, Hell SW. Loew LM, et al. Biophys J. 2013 Feb 19;104(4):741-3. doi: 10.1016/j.bpj.2013.01.011. Biophys J. 2013. PMID: 23442950 Free PMC article. No abstract available.

Similar articles

Cited by

References

    1. Denk W., Strickler J.H., Webb W.W. Two-photon laser scanning fluorescence microscopy. Science. 1990;248:73–76. - PubMed
    1. Svoboda K., Yasuda R. Principles of two-photon excitation microscopy and its applications to neuroscience. Neuron. 2006;50:823–839. - PubMed
    1. Hell S.W., Wichmann J. Breaking the diffraction resolution limit by stimulated emission: stimulated-emission-depletion fluorescence microscopy. Opt. Lett. 1994;19:780–782. - PubMed
    1. Nägerl U.V., Willig K.I., Bonhoeffer T. Live-cell imaging of dendritic spines by STED microscopy. Proc. Natl. Acad. Sci. USA. 2008;105:18982–18987. - PMC - PubMed
    1. Urban N.T., Willig K.I., Nägerl U.V. STED nanoscopy of actin dynamics in synapses deep inside living brain slices. Biophys. J. 2011;101:1277–1284. - PMC - PubMed

Publication types