. 2013 Feb 19;104(4):778-85.
doi: 10.1016/j.bpj.2012.12.054.

Two-photon excitation STED microscopy in two colors in acute brain slices

Affiliations

Two-photon excitation STED microscopy in two colors in acute brain slices

Philipp Bethge et al. Biophys J. .

Abstract

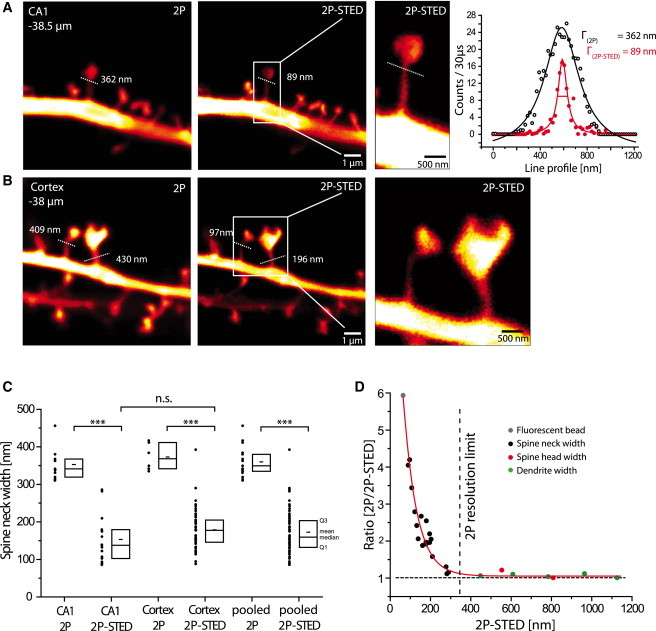
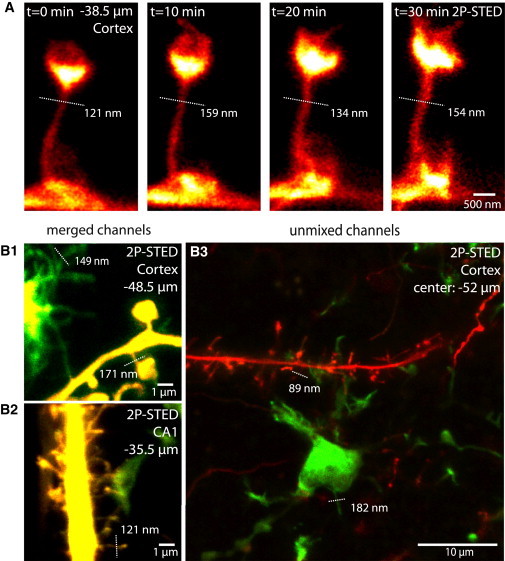
Many cellular structures and organelles are too small to be properly resolved by conventional light microscopy. This is particularly true for dendritic spines and glial processes, which are very small, dynamic, and embedded in dense tissue, making it difficult to image them under realistic experimental conditions. Two-photon microscopy is currently the method of choice for imaging in thick living tissue preparations, both in acute brain slices and in vivo. However, the spatial resolution of a two-photon microscope, which is limited to ~350 nm by the diffraction of light, is not sufficient for resolving many important details of neural morphology, such as the width of spine necks or thin glial processes. Recently developed superresolution approaches, such as stimulated emission depletion microscopy, have set new standards of optical resolution in imaging living tissue. However, the important goal of superresolution imaging with significant subdiffraction resolution has not yet been accomplished in acute brain slices. To overcome this limitation, we have developed a new microscope based on two-photon excitation and pulsed stimulated emission depletion microscopy, which provides unprecedented spatial resolution and excellent experimental access in acute brain slices using a long-working distance objective. The new microscope improves on the spatial resolution of a regular two-photon microscope by a factor of four to six, and it is compatible with time-lapse and simultaneous two-color superresolution imaging in living cells. We demonstrate the potential of this nanoscopy approach for brain slice physiology by imaging the morphology of dendritic spines and microglial cells well below the surface of acute brain slices.


Figures

Figure 1
Figure 1
Principle and design of a pulsed 2P-STED microscope. (A) Simplified Jablonski diagram of the molecular excitation states in 2P-STED microscopy. The molecule is excited to the excited state (S1) by two-photon absorption and returns from there to the ground state (S0) by the emission of fluorescence. The incidence of STED light quenches the fluorescence and returns the molecule to S0 before fluorescence can occur (curved dashed arrows show internal conversion). (B) Two-photon excitation action cross section and emission spectra for GFP and YFP (Warren Zipfel, Cornell University, Ithaca, NY). Simultaneous quenching of GFP and YFP by a single laser beam of 592 nm is possible because of the highly overlapping tails of the emission spectra. Two-photon excitation is performed at 910 nm. The emission signal is spectrally separated and detected in two channels. (C) Schematic of beam path. The femtosecond pulsed Ti:Sa laser used for 2P excitation is routed through a beam scanner into an upright microscope and synchronized with the STED laser (Ti:Sa/optical parametric oscillator (OPO)). Femtosecond pulses emitted from the Ti:Sa/OPO are broadened by a 20-m-long polarization-preserving single-mode fiber. The doughnut is formed by a helical phase mask. A long-working distance, water-immersion objective is used. It is equipped with a correction ring to correct spherical aberrations due to mismatches in refractive index at the lens-sample interface. λ/2, half-wave plate; λ/4, quarter-wave plate; DC, dichroic mirrors, NA, numerical aperture; Δt, pulse broadening fiber; xy-scan, scanner for x and y dimension; APD, avalanche photodiode; EOM = electro-optical modulator. (D) Reflections of the laser beams from gold particles used for visualization and spatial alignment of the excitation and STED beams. The laser beams are routed through a pellicle beam splitter so that the reflections can be detected by a photomultiplier tube. This allows for the characterization of the excitation and STED beams and illustrates the doughnut-like intensity distribution of the STED laser. Scale bar, 500 nm.
Figure 2
Figure 2
Fluorescence quenching and spatial resolution in 2P-STED microscopy. (A) Line scans in a fluorescent solution excited by the 2P laser. The signal is quenched by a pulsed STED laser. Desynchronization strongly attenuates this effect. (B) Quantification of the signal intensity along the rectangle indicated in A. Desynchronization greatly reduces quenching efficiency and increases variability. Fluorescence quenching is 80% when the 2P and STED pulses are synchronized and aligned in space and time. (C) 2P-STED requires a precise relative temporal delay of the synchronized laser pulses, which can be used to probe the duration of the STED laser pulse. Quenching efficiency is plotted as a function of the relative delay between the excitation and the STED beam. Fitting the data with a Gaussian error function (red) indicates a STED pulse duration (FWHM) of at least 68.5 ps. (D) 2P and 2P-STED images of fluorescent beads (diameter = 40 nm). A clear resolution enhancement can be observed in 2P-STED relative to 2P excitation. (E) Quantification of the line indicated in D and fitting with a Lorentzian function returns a width of 62 nm for 2P-STED (red) as compared with 368 nm for 2P (black).
Figure 3
Figure 3
2P-STED microscopy in acute brain slices. (A and B) 2P and 2P-STED images of dendritic spines of YFP-labeled CA1 (A) and cortical (B) pyramidal neurons in acute slices from Thy1-YFP transgenic mice. Spine necks appear much thinner in 2P-STED compared to 2P images. Dotted lines indicate spine neck widths (Lorentzian fit of the line profile of the line indicated). The difference in width between 2P imaging (Γ = 362 nm) and 2P-STED imaging (Γ = 89 nm) demonstrates the resolution enhancement by 2P-STED. (C) Quantification of spine neck widths of CA1 and cortex imaged in 2P and 2P-STED modes. No difference between CA1 and cortex was detected. 2P imaging clearly overestimates spine neck widths when compared to the 2P-STED mode. Boxplot indicate Q1 and Q3 (first and third quartile), median and mean (large and small lines, respectively). (D) Plot of 2P-STED measurements versus the ratio between 2P and 2P-STED of the same object. As expected, the ratio is 1 when the structures are larger than the resolution limit of 2P microscopy (∼350 nm), but it increases steeply when the structures are <350 nm in size.
Figure 4
Figure 4
Time-lapse and dual-color 2P-STED imaging. (A) Time-lapse images of a cortical spine acquired at 38.5 μm below the tissue surface. Individual time points are average projections of two frames based on multiple sections (5 frames/stack, four stacks, Δz = 400 nm). (B) Two-color 2P-STED imaging of neurons and microglia. Transgenic mice (CX3CR1+/eGFP; Thy1+/eYFP) express YFP in neurons and GFP in microglia. Superresolved microglial processes (Γ = 149 nm) can be observed (B1), as can a microglial process contacting dendritic spines (B2) and a maximum-intensity projection of a z-stack of images (19 frames, 40 × 40 μm, from −49.5 to −56.5 μm, Δz = 368 nm) in the cortex (B3). The high magnification images (B1 and B2) are merges of both color channels (green (GFP) and yellow (YFP)); the overview image (B3) is linearly unmixed, effectively separating both channels (green (GFP) and red (YFP)). Dotted lines indicate spine neck widths (Γ, Lorentzian fit of raw data).

Comment in

  • Superresolving dendritic spines.
    Loew LM, Hell SW. Loew LM, et al. Biophys J. 2013 Feb 19;104(4):741-3. doi: 10.1016/j.bpj.2013.01.011. Biophys J. 2013. PMID: 23442950 Free PMC article. No abstract available.

References

    1. Ramón y Cajal S. Oxford University Press; New York: 1995. Histology of the nervous system of man and vertebrates.
    1. Holtmaat A., Svoboda K. Experience-dependent structural synaptic plasticity in the mammalian brain. Nat. Rev. Neurosci. 2009;10:647–658. - PubMed
    1. Araque A., Carmignoto G., Haydon P.G. Dynamic signaling between astrocytes and neurons. Annu. Rev. Physiol. 2001;63:795–813. - PubMed
    1. Tremblay M.E., Stevens B., Nimmerjahn A. The role of microglia in the healthy brain. J. Neurosci. 2011;31:16064–16069. - PMC - PubMed
    1. Hell S.W. Far-field optical nanoscopy. Science. 2007;316:1153–1158. - PubMed

Publication types