

Do clustering monoclonal antibody solutions really have a concentration dependence of viscosity?
- PMID: 23442970
- PMCID: PMC3576527
- DOI: 10.1016/j.bpj.2013.01.007
Do clustering monoclonal antibody solutions really have a concentration dependence of viscosity?
Abstract
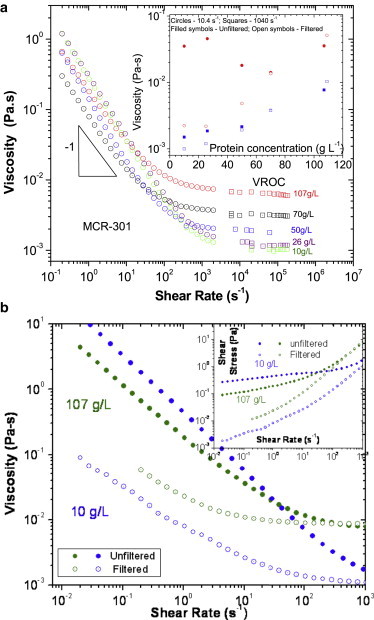
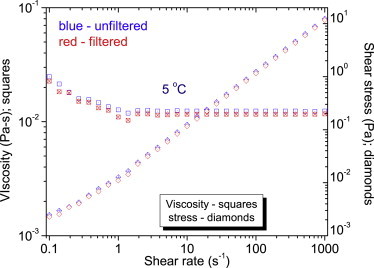
Protein solution rheology data in the biophysics literature have incompletely identified factors that govern hydrodynamics. Whereas spontaneous protein adsorption at the air/water (A/W) interface increases the apparent viscosity of surfactant-free globular protein solutions, it is demonstrated here that irreversible clusters also increase system viscosity in the zero shear limit. Solution rheology measured with double gap geometry in a stress-controlled rheometer on a surfactant-free Immunoglobulin solution demonstrated that both irreversible clusters and the A/W interface increased the apparent low shear rate viscosity. Interfacial shear rheology data showed that the A/W interface yields, i.e., shows solid-like behavior. The A/W interface contribution was smaller, yet nonnegligible, in double gap compared to cone-plate geometry. Apparent nonmonotonic composition dependence of viscosity at low shear rates due to irreversible (nonequilibrium) clusters was resolved by filtration to recover a monotonically increasing viscosity-concentration curve, as expected. Although smaller equilibrium clusters also existed, their size and effective volume fraction were unaffected by filtration, rendering their contribution to viscosity invariant. Surfactant-free antibody systems containing clusters have complex hydrodynamic response, reflecting distinct bulk and interface-adsorbed protein as well as irreversible cluster contributions. Literature models for solution viscosity lack the appropriate physics to describe the bulk shear viscosity of unstable surfactant-free antibody solutions.
Copyright © 2013 Biophysical Society. Published by Elsevier Inc. All rights reserved.
Figures


Similar articles
-
Both protein adsorption and aggregation contribute to shear yielding and viscosity increase in protein solutions.Soft Matter. 2014 Jan 7;10(1):122-31. doi: 10.1039/c3sm51994e. Soft Matter. 2014. PMID: 24651563
-
Probing Shear Thinning Behaviors of IgG Molecules at the Air-Water Interface via Rheological Methods.Langmuir. 2016 Jan 19;32(2):496-504. doi: 10.1021/acs.langmuir.5b03806. Epub 2016 Jan 5. Langmuir. 2016. PMID: 26673996
-
High shear rheology and anisotropy in concentrated solutions of monoclonal antibodies.J Pharm Sci. 2013 Aug;102(8):2538-49. doi: 10.1002/jps.23647. Epub 2013 Jul 19. J Pharm Sci. 2013. PMID: 23873347
-
Thermodynamics, adsorption kinetics and rheology of mixed protein-surfactant interfacial layers.Adv Colloid Interface Sci. 2009 Aug 30;150(1):41-54. doi: 10.1016/j.cis.2009.05.002. Epub 2009 May 15. Adv Colloid Interface Sci. 2009. PMID: 19493522 Review.
-
Shear rheology of mixed protein adsorption layers vs their structure studied by surface force measurements.Adv Colloid Interface Sci. 2015 Aug;222:148-61. doi: 10.1016/j.cis.2014.04.009. Epub 2014 May 2. Adv Colloid Interface Sci. 2015. PMID: 24828304 Review.
Cited by
-
Protein aggregation and its impact on product quality.Curr Opin Biotechnol. 2014 Dec;30:211-7. doi: 10.1016/j.copbio.2014.08.001. Epub 2014 Aug 28. Curr Opin Biotechnol. 2014. PMID: 25173826 Free PMC article. Review.
-
Classical and Nonclassical Nucleation Mechanisms of Insulin Crystals.ACS Omega. 2024 May 13;9(22):23364-23376. doi: 10.1021/acsomega.3c10052. eCollection 2024 Jun 4. ACS Omega. 2024. PMID: 38854527 Free PMC article.
-
Viscosity Prediction of High-Concentration Antibody Solutions with Atomistic Simulations.J Chem Inf Model. 2023 Oct 9;63(19):6129-6140. doi: 10.1021/acs.jcim.3c00947. Epub 2023 Sep 27. J Chem Inf Model. 2023. PMID: 37757589 Free PMC article.
-
The limitations of an exclusively colloidal view of protein solution hydrodynamics and rheology.Biophys J. 2013 Nov 19;105(10):2418-26. doi: 10.1016/j.bpj.2013.10.012. Biophys J. 2013. PMID: 24268154 Free PMC article.
-
Hydrogen exchange mass spectrometry reveals protein interfaces and distant dynamic coupling effects during the reversible self-association of an IgG1 monoclonal antibody.MAbs. 2015;7(3):525-39. doi: 10.1080/19420862.2015.1029217. MAbs. 2015. PMID: 25875351 Free PMC article.
References
-
- Köhler G., Milstein C. Continuous cultures of fused cells secreting antibody of predefined specificity. Nature. 1975;256:495–497. - PubMed
-
- The Nobel Prize in Physiology or Medicine. 1984. http://www.nobelprize.org/nobel_prizes/medicine/laureates/1984/.
-
- Leader B., Baca Q.J., Golan D.E. Protein therapeutics: a summary and pharmacological classification. Nat. Rev. Drug Discov. 2008;7:21–39. - PubMed
-
- Shire S.J. Formulation and manufacturability of biologics. Curr. Opin. Biotechnol. 2009;20:708–714. - PubMed
-
- DeYoung L.R., Fink A.L., Dill K.A. Aggregation of globular proteins. Acc. Chem. Res. 1993;26:614–620.
MeSH terms
Substances
LinkOut - more resources
Full Text Sources
Other Literature Sources
Miscellaneous
