

Stochastic model-assisted development of efficient low-dose viral transduction in microfluidics
- PMID: 23442972
- PMCID: PMC3576536
- DOI: 10.1016/j.bpj.2012.12.049
Stochastic model-assisted development of efficient low-dose viral transduction in microfluidics
Abstract
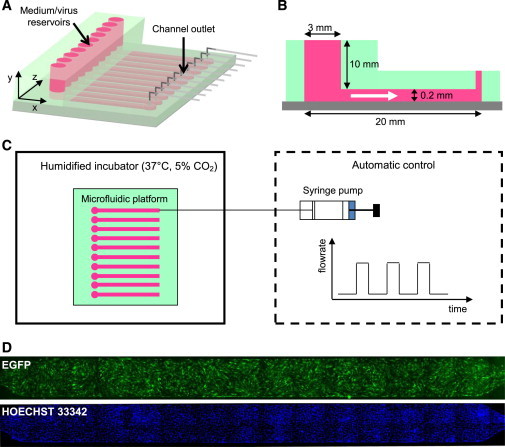
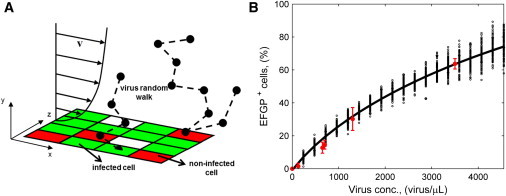
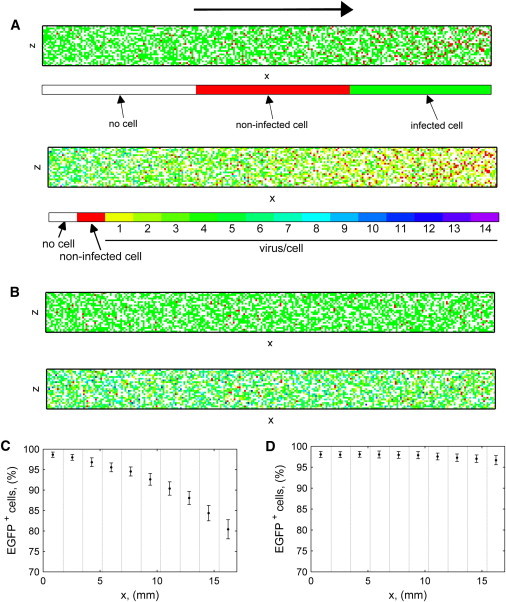
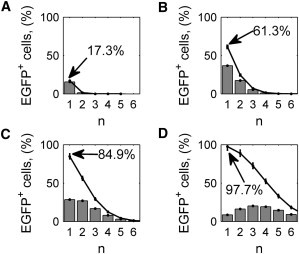
Adenoviruses are commonly used in vitro as gene transfer vectors in multiple applications. Nevertheless, issues such as low infection efficiency and toxicity effects on host cells have not been resolved yet. This work aims at developing a new versatile tool to enhance the expression of transduced genes while working at low viral doses in a sequential manner. We developed a microfluidic platform with automatically controlled sequential perfusion stages, which includes 10 independent channels. In addition, we built a stochastic mathematical model, accounting for the discrete nature of cells and viruses, to predict not only the percentage of infected cells, but also the associated infecting-virus distribution in the cell population. Microfluidic system and mathematical model were coupled to define an efficient experimental strategy. We used human foreskin fibroblasts, infected by replication-incompetent adenoviruses carrying EGFP gene, as the testing system. Cell characterization was performed through fluorescence microscopy, followed by image analysis. We explored the effect of different aspects: perfusion, multiplicity of infection, and temporal patterns of infection. We demonstrated feasibility of performing efficient viral transduction at low doses, by repeated pulses of cell-virus contact. This procedure also enhanced the exogenous gene expression in the sequential microfluidic infection system compared to a single infection at a higher, nontoxic, viral dose.
Copyright © 2013 Biophysical Society. Published by Elsevier Inc. All rights reserved.
Figures
Similar articles
-
Pseudotyped adeno-associated viral vectors for gene transfer in dermal fibroblasts: implications for wound-healing applications.J Surg Res. 2013 Sep;184(1):691-8. doi: 10.1016/j.jss.2013.03.051. Epub 2013 Apr 3. J Surg Res. 2013. PMID: 23590866 Free PMC article.
-
Sensitization to enhanced green fluorescence protein minor histocompatibility antigen by gene transduction into dendritic cells and peritoneal exudate macrophages.Transpl Immunol. 2007 Nov;18(2):73-84. doi: 10.1016/j.trim.2007.04.003. Epub 2007 Jun 6. Transpl Immunol. 2007. PMID: 18005848
-
Comparison of murine leukemia virus, human immunodeficiency virus, and adeno-associated virus vectors for gene transfer in multiple myeloma: lentiviral vectors demonstrate a striking capacity to transduce low-proliferating primary tumor cells.Hum Gene Ther. 2003 Dec 10;14(18):1727-39. doi: 10.1089/104303403322611746. Hum Gene Ther. 2003. PMID: 14670124
-
In vitro adenovirus mediated gene transfer to the human cornea.Br J Ophthalmol. 2005 Jun;89(6):658-61. doi: 10.1136/bjo.2004.061754. Br J Ophthalmol. 2005. PMID: 15923495 Free PMC article.
-
Enhanced gene transfer to pancreatic islets using glucagon-like peptide-1.Transplant Proc. 2013 Mar;45(2):591-6. doi: 10.1016/j.transproceed.2012.10.040. Transplant Proc. 2013. PMID: 23498795
Cited by
-
Simplified prototyping of perfusable polystyrene microfluidics.Biomicrofluidics. 2014 Jul 30;8(4):046501. doi: 10.1063/1.4892035. eCollection 2014 Jul. Biomicrofluidics. 2014. PMID: 25379106 Free PMC article.
-
High-efficiency cellular reprogramming with microfluidics.Nat Methods. 2016 May;13(5):446-52. doi: 10.1038/nmeth.3832. Epub 2016 Apr 18. Nat Methods. 2016. PMID: 27088312
-
Evaluating the antioxidant potential of resveratrol-gold nanoparticles in preventing oxidative stress in endothelium on a chip.Sci Rep. 2023 Dec 1;13(1):21344. doi: 10.1038/s41598-023-47291-6. Sci Rep. 2023. PMID: 38049439 Free PMC article.
-
High-Throughput Platform for Efficient Chemical Transfection, Virus Packaging, and Transduction.Micromachines (Basel). 2019 Jun 10;10(6):387. doi: 10.3390/mi10060387. Micromachines (Basel). 2019. PMID: 31185602 Free PMC article.
-
In vitro metabolic zonation through oxygen gradient on a chip.Sci Rep. 2019 Sep 19;9(1):13557. doi: 10.1038/s41598-019-49412-6. Sci Rep. 2019. PMID: 31537830 Free PMC article.
References
-
- Wu Z.J., Asokan A., Samulski R.J. Adeno-associated virus serotypes: vector toolkit for human gene therapy. Mol. Ther. 2006;14:316–327. - PubMed
-
- Ames R.S., Lu Q. Viral-mediated gene delivery for cell-based assays in drug discovery. Expert. Opin. Drug Discov. 2009;4:243–256. - PubMed
-
- Takahashi K., Tanabe K., Yamanaka S. Induction of pluripotent stem cells from adult human fibroblasts by defined factors. Cell. 2007;131:861–872. - PubMed
Publication types
MeSH terms
Substances
LinkOut - more resources
Full Text Sources
Other Literature Sources
