Randomized Controlled Trial
. 2013 Feb 25:7:27.
doi: 10.3389/fncir.2013.00027. eCollection 2013.

Assisted closed-loop optimization of SSVEP-BCI efficiency

Affiliations
Randomized Controlled Trial

Assisted closed-loop optimization of SSVEP-BCI efficiency

Jacobo Fernandez-Vargas et al. Front Neural Circuits. .

Abstract

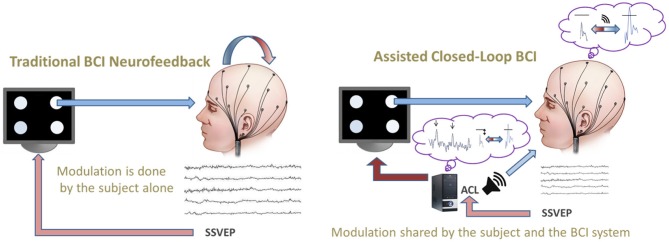
We designed a novel assisted closed-loop optimization protocol to improve the efficiency of brain-computer interfaces (BCI) based on steady state visually evoked potentials (SSVEP). In traditional paradigms, the control over the BCI-performance completely depends on the subjects' ability to learn from the given feedback cues. By contrast, in the proposed protocol both the subject and the machine share information and control over the BCI goal. Generally, the innovative assistance consists in the delivery of online information together with the online adaptation of BCI stimuli properties. In our case, this adaptive optimization process is realized by (1) a closed-loop search for the best set of SSVEP flicker frequencies and (2) feedback of actual SSVEP magnitudes to both the subject and the machine. These closed-loop interactions between subject and machine are evaluated in real-time by continuous measurement of their efficiencies, which are used as online criteria to adapt the BCI control parameters. The proposed protocol aims to compensate for variability in possibly unknown subjects' state and trait dimensions. In a study with N = 18 subjects, we found significant evidence that our protocol outperformed classic SSVEP-BCI control paradigms. Evidence is presented that it takes indeed into account interindividual variabilities: e.g., under the new protocol, baseline resting state EEG measures predict subjects' BCI performances. This paper illustrates the promising potential of assisted closed-loop protocols in BCI systems. Probably their applicability might be expanded to innovative uses, e.g., as possible new diagnostic/therapeutic tools for clinical contexts and as new paradigms for basic research.

Keywords: BCI illiteracy; BCI performance predictor; activity-dependent stimulation; brain-computer interface; brain-machine interface; individual alpha frequency; resting state EEG; resting state network.


Figures

Figure 1
Figure 1
Comparison of a traditional BCI neurofeedback (left) vs. the novel assisted closed-loop paradigm (right) which informs both the subject (about his/her brain activity in relation to the BCI goal) and the system (about the specificities of the given subject). In our example, the assisted closed-loop provides online information (i) to the system about the most effective flicker frequencies and (ii) to the subject about the actual distance to the pre-defined threshold by continuous auditory feedback (loudspeaker symbol, right).
Figure 2
Figure 2
Diagram of the BCI flicker stimulation setup (left) and the signal acquisition/stimulation system. The flickering frequency was controlled by a software driving the digital output of a National Instruments data acquisition (DAQ) board (model NI-PCI-6251) directly connected to the white colored LEDs, generating 0/+5V off vs. on signals according to the desired flicker frequency. We verified the intended flicker frequency for each light source independently by a photodiode connected to a digital oscilloscope. Luminous intensity output is IV ≈ 700 mcd for each white LED. Smaller green color standard signaling LEDs were placed below to instruct subjects where to look during the BCI task.
Figure 3
Figure 3
Timeline of the experiment. In the first phase individual EEG baseline activity is measured and in the following frequency scanning phase those frequencies electing largest SSVEP magnitudes are selected for each subject individually, while those below a predefined threshold are excluded (Top Freq.). Later, these values are used in the BCI phase. Under the prefixed frequency condition, always the same frequency set of 27, 28, 29, and 30 Hz is used for stimulation. Red boxes indicate stimulation, blue resting periods and gray baseline recording; in each box durations are reported.
Figure 4
Figure 4
Signal chain of acquisition and online preprocessing. Input signals are the time domain EEG signals at electrodes Oz and POz sampled at 1024 Hz which finally result in normalized SSVEP spectral power densities Sf for each of the 20 stimulation frequencies f using as transformation to frequency domain the Fast Fourier Transform (FFT).
Figure 5
Figure 5
(A) Example of EEG time domain signals during 3 s before and after 21 Hz flicker stimulation at electrodes Oz (red) and POz (blue). Using their difference signal (black) as BCI input, in the sense of a bipolar montage, remarkably reduces common DC offsets, EOG/EMG artifacts and EEG contributions other than due to the visual cortex: the difference signal offers a simple spatial high-pass filter. (B) Example of signal-to-noise ratios Sf during a single iteration of the algorithm ACL using four different flicker frequencies. The gray shadowed area represents the noise floor with dimensionless value 10; this level was defined as SSVEP detection threshold for all subjects. Horizontal lines indicate the detection duration of each target frequency at each step.
Figure 6
Figure 6
(A and B) SSVEP-SNR frequency-response curves. (A) Mdns over all N = 18 subjects, (B) example of two subjects with opposed frequency-response curves (black # subject 16, blue #9). (C) Frequency-dependent interindividual association between SSVEP-SNR magnitudes and ITR performances under the three experimental conditions, computed as Spearman's rank order correlations: (i) ACL algorithm (red), (ii) top (blue) and (iii) prefixed (black), filled circles represent significant p < 0.05.
Figure 7
Figure 7
Scatterplot of baseline resting state relative mean betaMid PSDs at Oz vs. ITRMean in condition (i) ACL algorithm, 95% confidence regression bands as dotted lines, subject numbers in bold, Mahalanobis distances in brackets calculated in a linear regression analysis with the ITRMean as criterion variables and relative mean betaMid PSDs as predictor variables. Subject 15 and 11 (in red) might be considered as outliers (see text). Excluding them changes the Pearson correlation from r = −0.262, p = 0.294 to significant r = −0.510, p = 0.043.
Figure 8
Figure 8
Scatterplot of individual alpha frequency (IAF) vs. ITRMean under condition (i) ACL algorithm (best-fit regression line for N = 12 as continuous line, 95% confidence regression bands as dotted lines). A significant Pearson correlation with r = 0.577, p = 0.0496 was found in the remaining subsample of N = 12 (blue points), removing subjects with NTrials < 25th percentile (8.75 ≈ 9) (red points), while over the entire sample of N = 18 the correlation is hidden with r = 0.282, p = 0.257 (all points). This relationship seems to exist exclusively for condition (i) ACL algorithm: the higher subjects' IAF are in this subsample, the better will be their ITRMean performance exclusively under (i). Partial correlation analyses confirmed that this association is linearly independent against age.

References

    1. Bayram A., Bayraktaroglu Z., Karahan E., Erdogan B., Bilgic B., Ozker M., et al. (2011). Simultaneous EEG/fMRI analysis of the resonance phenomena in steady-state visual evoked responses. Clin. EEG Neurosci. 42, 98–106 10.1177/155005941104200210 - DOI - PubMed
    1. Birbaumer N. (2006). Breaking the silence: brain-computer interfaces (BCI) for communication and motor control. Psychophysiology 43, 517–532 10.1111/j.1469-8986.2006.00456.x - DOI - PubMed
    1. Blankertz B., Sannelli C., Halder S., Hammer E. M., Kübler A., Müller K.-R., et al. (2010). Neurophysiological predictor of SMR-based BCI performance. Neuroimage 51, 1303–1309 10.1016/j.neuroimage.2010.03.022 - DOI - PubMed
    1. Capilla A., Pazo-Alvarez P., Darriba A., Campo P., Gross J. (2011). Steady-state visual evoked potentials can be explained by temporal superposition of transient event-related responses. PLoS ONE 6:e14543 10.1371/journal.pone.0014543 - DOI - PMC - PubMed
    1. Chamorro P., Levi R., Rodriguez F. B., Pinto R. D., Varona P. (2009). Real-time activity-dependent drug microinjection. BMC Neuroscience 10:P296 10.1186/1471-2202-10-S1-P296 - DOI

Publication types