

Advanced microscopy of star-shaped gold nanoparticles and their adsorption-uptake by macrophages
- PMID: 23443314
- PMCID: PMC3634588
- DOI: 10.1039/c3mt20202j
Advanced microscopy of star-shaped gold nanoparticles and their adsorption-uptake by macrophages
Abstract
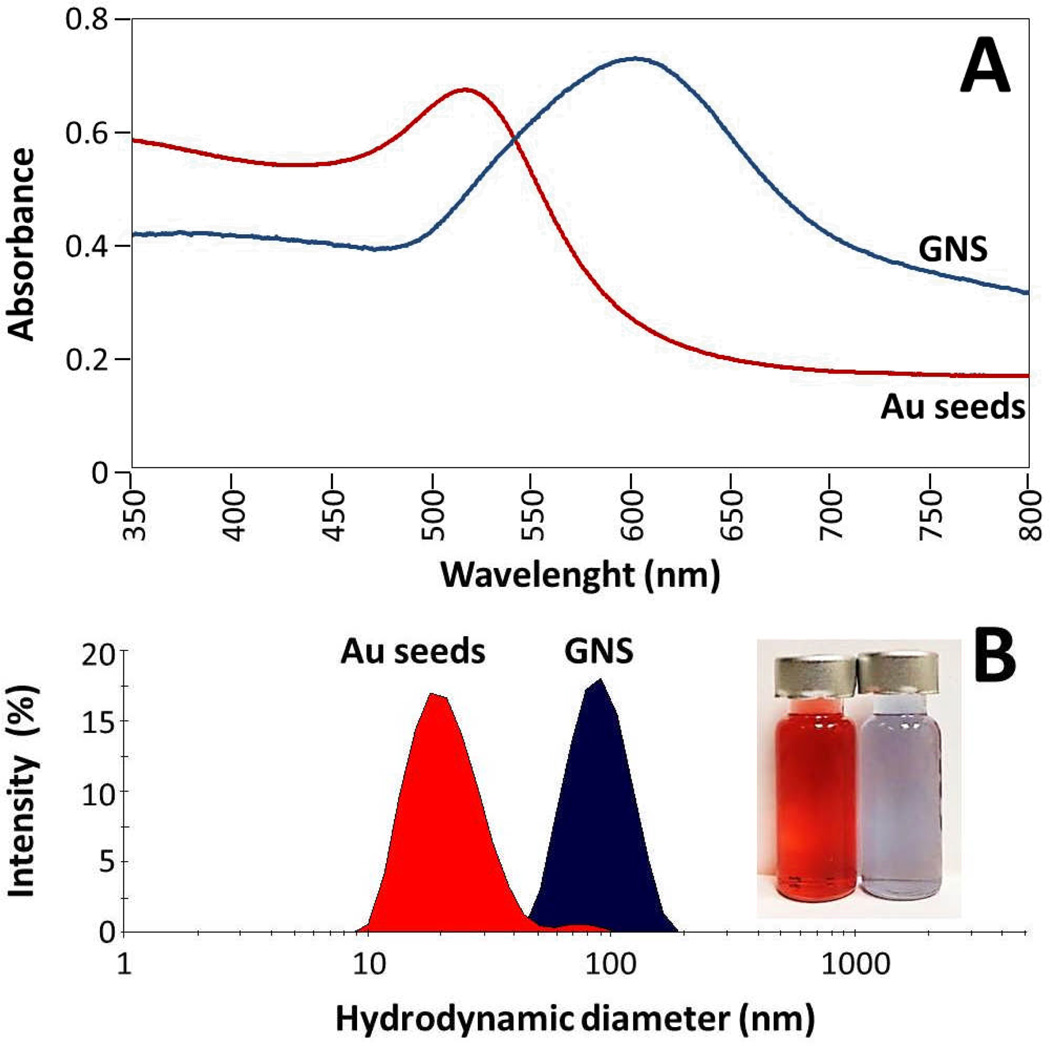
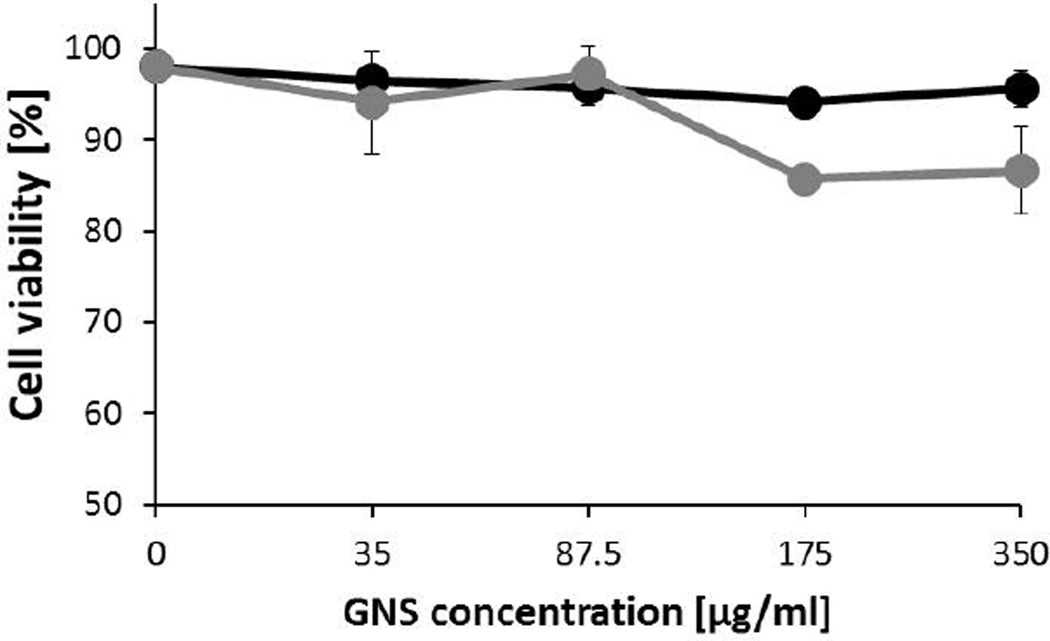
Metallic nanoparticles have diverse applications in biomedicine, as diagnostics, image contrast agents, nanosensors and drug delivery systems. Anisotropic metallic nanoparticles possess potential applications in cell imaging and therapy + diagnostics (theranostics), but controlled synthesis and growth of these anisotropic or branched nanostructures has been challenging and usually require use of high concentrations of surfactants. Star-shaped gold nanoparticles were synthesized in high yield through a seed mediated route using HEPES as a precise shape-directing capping agent. Characterization was performed using advanced electron microscopy techniques including atomic resolution TEM, obtaining a detailed characterization of nanostructure and atomic arrangement. Spectroscopy techniques showed that the particles have narrow size distribution, monodispersity and high colloidal stability, with absorbance into NIR region and high efficiency for SERS applications. Gold nanostars showed to be biocompatible and efficiently adsorbed and internalized by macrophages, as revealed by advanced FE-SEM and backscattered electron imaging techniques of complete unstained uncoated cells. Additionally, low voltage STEM and X-ray microanalysis revealed the ultra-structural location and confirmed stability of nanoparticles after endocytosis with high spatial resolution.
Figures


Similar articles
-
Biodirected synthesis and nanostructural characterization of anisotropic gold nanoparticles.Langmuir. 2015 Mar 24;31(11):3527-36. doi: 10.1021/acs.langmuir.5b00084. Epub 2015 Mar 13. Langmuir. 2015. PMID: 25742562
-
Imaging interactions of metal oxide nanoparticles with macrophage cells by ultra-high resolution scanning electron microscopy techniques.Integr Biol (Camb). 2012 Nov;4(11):1358-66. doi: 10.1039/c2ib20172k. Integr Biol (Camb). 2012. PMID: 23023106 Free PMC article.
-
Gold nanostar synthesis with a silver seed mediated growth method.J Vis Exp. 2012 Jan 15;(59):3570. doi: 10.3791/3570. J Vis Exp. 2012. PMID: 22297908 Free PMC article.
-
Microbial synthesis of gold nanoparticles: current status and future prospects.Adv Colloid Interface Sci. 2014 Jul;209:40-8. doi: 10.1016/j.cis.2013.12.011. Epub 2014 Jan 2. Adv Colloid Interface Sci. 2014. PMID: 24456802 Review.
-
Gold Nanoclusters, Gold Nanoparticles, and Analytical Techniques for Their Characterization.Methods Mol Biol. 2020;2118:351-382. doi: 10.1007/978-1-0716-0319-2_26. Methods Mol Biol. 2020. PMID: 32152992 Review.
Cited by
-
Probing the Intracellular Bio-Nano Interface in Different Cell Lines with Gold Nanostars.Nanomaterials (Basel). 2021 Apr 30;11(5):1183. doi: 10.3390/nano11051183. Nanomaterials (Basel). 2021. PMID: 33946192 Free PMC article.
-
Plasmon Tunability of Gold Nanostars at the Tip Apexes.ACS Omega. 2018 Dec 12;3(12):17173-17179. doi: 10.1021/acsomega.8b02686. eCollection 2018 Dec 31. ACS Omega. 2018. PMID: 31458336 Free PMC article.
-
Shape-dependent gold nanoparticle interactions with a model cell membrane.Biointerphases. 2022 Nov 8;17(6):061003. doi: 10.1116/6.0002183. Biointerphases. 2022. PMID: 36347646 Free PMC article.
-
Simultaneous Noninvasive Detection and Therapy of Atherosclerosis Using HDL Coated Gold Nanorods.Diagnostics (Basel). 2022 Feb 23;12(3):577. doi: 10.3390/diagnostics12030577. Diagnostics (Basel). 2022. PMID: 35328130 Free PMC article.
-
SERS-active Au/SiO2 clouds in powder for rapid ex vivo breast adenocarcinoma diagnosis.Biomed Opt Express. 2016 May 27;7(6):2407-18. doi: 10.1364/BOE.7.002407. eCollection 2016 Jun 1. Biomed Opt Express. 2016. PMID: 27375955 Free PMC article.
References
-
- Minelli C, Lowe SB, Stevens MM. Small. 2010;21:2336–2357. - PubMed
-
- Guerrero-Martínez A, Barbosa S, Pastoriza-Santos I, Liz-Marzán LM. Curr. Op. Colloid. Interface. Sci. 2011;16:118–127.
-
- Maiorano G, Rizzello L, Malvindi MA, Shankar SS, Martiradonna L, Falqui A, Cingolani R, Pompa PP. Nanoscale. 2011;3:2227–2232. - PubMed
Publication types
MeSH terms
Substances
Grants and funding
LinkOut - more resources
Full Text Sources
Other Literature Sources
Miscellaneous
