. 2013:4:1528.
doi: 10.1038/ncomms2537.

De novo lipogenesis in human fat and liver is linked to ChREBP-β and metabolic health

Affiliations

De novo lipogenesis in human fat and liver is linked to ChREBP-β and metabolic health

Leah Eissing et al. Nat Commun. 2013.

Abstract

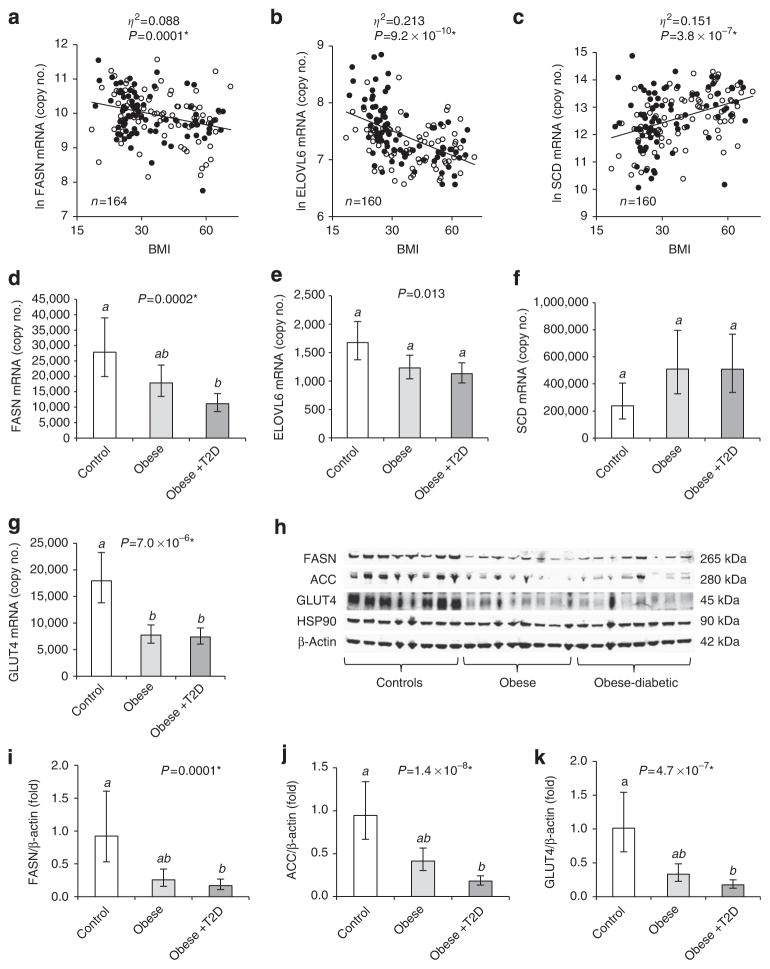
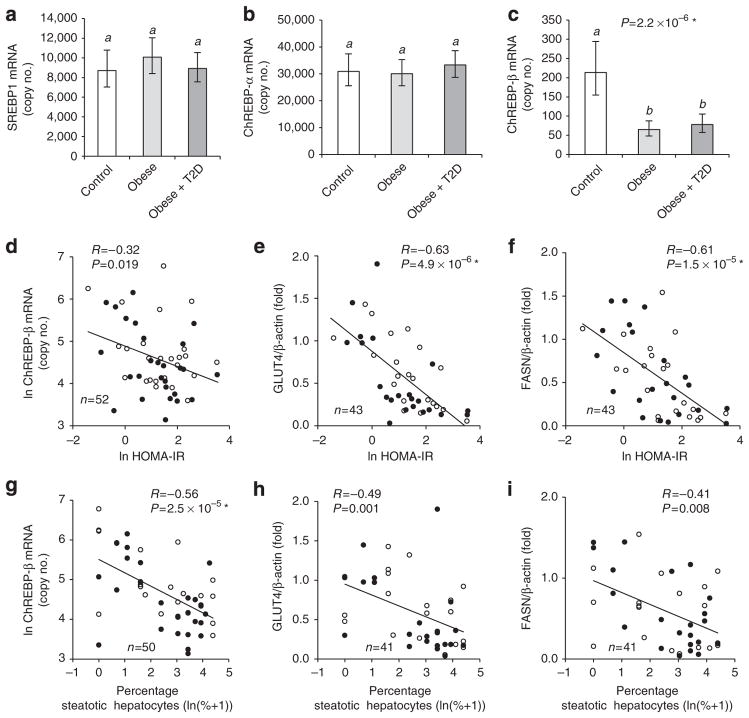
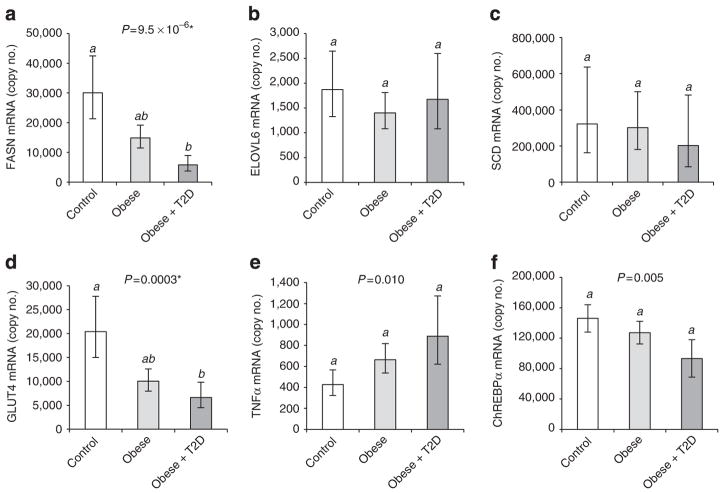
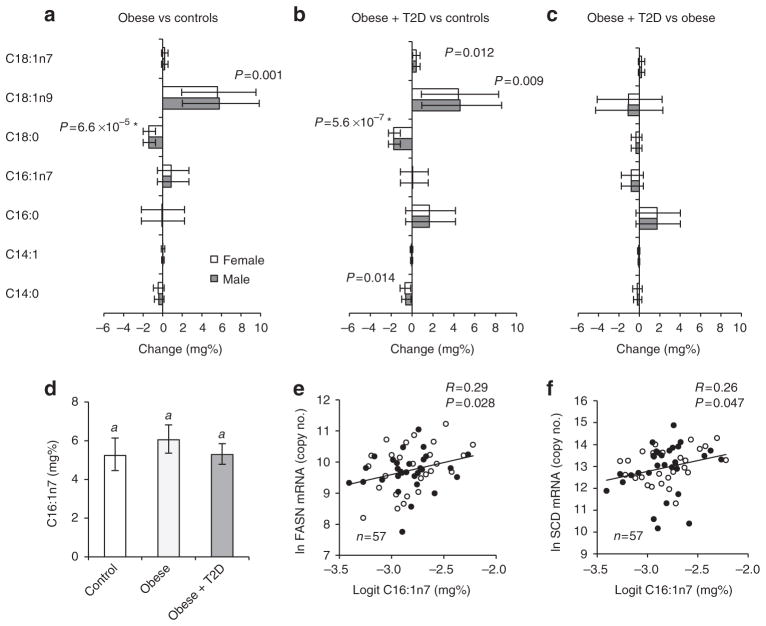
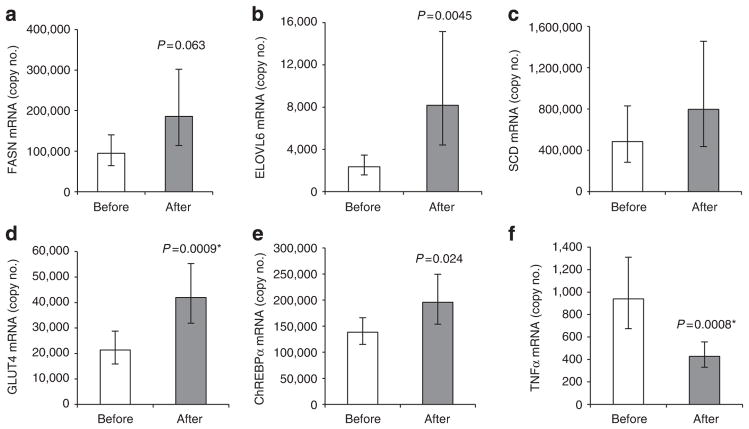
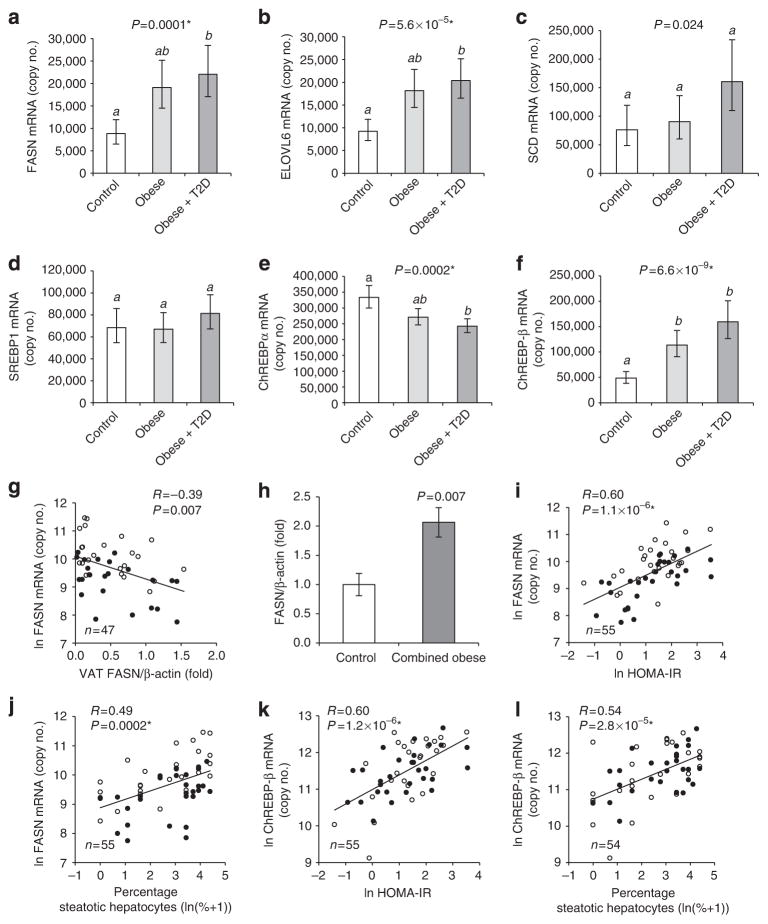
Clinical interest in de novo lipogenesis has been sparked by recent studies in rodents demonstrating that de novo lipogenesis specifically in white adipose tissue produces the insulin-sensitizing fatty acid palmitoleate. By contrast, hepatic lipogenesis is thought to contribute to metabolic disease. How de novo lipogenesis in white adipose tissue versus liver is altered in human obesity and insulin resistance is poorly understood. Here we show that lipogenic enzymes and the glucose transporter-4 are markedly decreased in white adipose tissue of insulin-resistant obese individuals compared with non-obese controls. By contrast, lipogenic enzymes are substantially upregulated in the liver of obese subjects. Bariatric weight loss restored de novo lipogenesis and glucose transporter-4 gene expression in white adipose tissue. Notably, lipogenic gene expression in both white adipose tissue and liver was strongly linked to the expression of carbohydrate-responsive element-binding protein-β and to metabolic risk markers. Thus, de novo lipogenesis predicts metabolic health in humans in a tissue-specific manner and is likely regulated by glucose-dependent carbohydrate-responsive element-binding protein activation.


Conflict of interest statement

Competing financial interests: The authors declare no competing financial interests.

Figures

Figure 1
Figure 1. Expression of metabolic and lipogenic genes in VAT of obese subjects
Log-transformed copy numbers of FASN (a), ELOVL6 (b) and SCD (c) mRNA in VAT plotted against BMI (logarithmic scale, non-logarithmic numbers), and group analysis comparing FASN (d), ELOVL6 (e), SCD (f) and GLUT4 (g) mRNA (n = 19–21), as well as FASN (i), ACC (j) and GLUT4 (k) protein (n =14–17) in VAT of non-obese, obese and obese-diabetic (obese + T2D) subjects. ac, open and closed circles are females and males, respectively. Trend lines as determined by ANCOVA including BMI as independent variable and gender as confounder are depicted as broken and solid lines for females and males, respectively. Effect size for BMI is described by partial eta-squared values (η2), describing the proportion of total variation attributable to BMI. ANCOVA including age and interaction terms, see Supplementary Table S1. (h) Representative VAT western blot. dg and ik, estimated marginal means with 95% confidence intervals as determined by ANCOVA. GLUT4 protein and mRNA levels were significantly higher in females compared with males (Supplementary Fig. S4). Groups identified by the same superscript letters (a,b) are not significantly different from each other (P≥0.0005). *Significant after adjustment for multiple testing.
Figure 2
Figure 2. VAT ChREBP-β, FASN and GLUT4 are inversely linked to HOMA-IR and liver steatosis
Group analysis (n =17–21) comparing mRNA copy numbers of SREBP1 (a), ChREBP-α (b) and ChREBP-β (c) in VAT of non-obese, obese and obese-diabetic subjects. Pearson correlation analysis of VAT ChREBP-β mRNA (d,g), GLUT4 protein (e,h) and FASN protein (f,i) with HOMA-IR (df) and liver steatosis (gi). ac, estimated marginal means with 95% confidence intervals as determined by ANCOVA. Groups identified by the same letters (a,b) are not significantly different from each other (P≥0.0005). SREBP1 and ChREBP-β mRNA were significantly higher in females compared with males (Supplementary Fig. S4). *Significant after adjustment for multiple testing.
Figure 3
Figure 3. SAT lipogenic gene expression in obese compared with non-obese subjects
Expression of FASN (a), ELOVL6 (b), SCD (c), GLUT4 (d), tumour necrosis factor-α (e) and ChREBP-α (f) mRNA in SAT. The subjects are a subset of the experimental groups described in Table 1. Numbers (female/male): controls (6/6), obese (9/10), obese-diabetic (2/5). Estimated marginal means with 95% confidence intervals, as determined by ANCOVA. Groups identified by the same letters (a,b) are not significantly different from each other (P≥0.0005). FASN, SCD and GLUT4 expressions were higher in females compared with males (Supplementary Fig. S4). *Significant after adjustment for multiple testing.
Figure 4
Figure 4. VAT fatty acid concentrations are changed in obesity
Mean change (95% confidence interval) relative to total VAT fatty acids in obese versus controls (a), obese-diabetic versus controls (b), obese-diabetic versus obese (c). Estimated means and 95% confidence intervals of C16:1n7 (d) in controls, obese, obese-diabetic (n =15–21). Correlation of VAT C16:1n7 with mRNA expression of FASN (e) and SCD (f). Open bars and symbols are females; R, Pearson correlation coefficient. *Significant after adjustment for multiple testing.
Figure 5
Figure 5. Bariatric intervention increases expression of DNL-related genes and decreases tumour necrosis factor-α (TNF-α) expression in SAT
FASN (a), ELOVL6 (b), SCD (c), GLUT4 (d), ChREBP-α (e) and TNF-α (f) mRNA in SAT samples of bariatric surgery patients (n = 16–20) before and after weight loss. Means and 95% confidence intervals, paired t-test of log-transformed values. *Significant after adjustment for multiple testing.
Figure 6
Figure 6. Hepatic DNL is linked to higher BMI, HOMA-IR and liver steatosis
Group analysis (n = 19–21) comparing liver mRNA expression of FASN (a), ELOVL6 (b), SCD (c), SREBP1 (d), ChREBP-α (e) and ChREBP-β (f) of non-obese, obese and obese-diabetic subjects. (af) Estimated marginal means with 95% confidence intervals as determined by ANCOVA. FASN mRNA is significantly higher in females compared with males (Supplementary Fig. S4). Groups identified by the same letters (a,b) are not significantly different from each other (P≥0.0005). Correlation of liver FASN mRNA with VAT FASN protein (g). FASN protein expression in non-obese subjects (n =13) compared with combined obese and obese-diabetic (n = 15) (h), means±s.e.m., two-tailed t-test. Pearson correlation analysis of liver FASN mRNA (i,j) and liver ChREBP-β mRNA (k,l) with HOMA-IR (i,k) and liver steatosis (j,l). *Significant after adjustment for multiple testing.

References

    1. Rosen ED, Spiegelman B. Adipocytes as regulators of energy balance and glucose homeostasis. Nature. 2006;444:847–853. - PMC - PubMed
    1. Virtue S, Vidal-Puig A. Adipose tissue expandability, lipotoxicity and the metabolic syndrome—an allostatic perspective. Biochim Biophys Acta. 2010;1801:338–349. - PubMed
    1. Farese RV, Jr, Zechner R, Newgard CB, Walther TC. The problem of establishing relationships between hepatic steatosis and hepatic insulin resistance. Cell Metab. 2012;15:570–573. - PMC - PubMed
    1. Cao H, et al. Identification of a lipokine, a lipid hormone linking adipose tissue to systemic metabolism. Cell. 2008;134:933–944. - PMC - PubMed
    1. Huo Y, et al. Targeted overexpression of inducible 6-phosphofructo-2-kinase in adipose tissue increases fat deposition but protects against diet-induced insulin resistance and inflammatory responses. J Biol Chem. 2012;287:21492–21500. - PMC - PubMed

Publication types

MeSH terms

LinkOut - more resources