

Role of genetic heterogeneity and epistasis in bladder cancer susceptibility and outcome: a learning classifier system approach
- PMID: 23444013
- PMCID: PMC3721175
- DOI: 10.1136/amiajnl-2012-001574
Role of genetic heterogeneity and epistasis in bladder cancer susceptibility and outcome: a learning classifier system approach
Abstract
Background and objective: Detecting complex patterns of association between genetic or environmental risk factors and disease risk has become an important target for epidemiological research. In particular, strategies that provide multifactor interactions or heterogeneous patterns of association can offer new insights into association studies for which traditional analytic tools have had limited success.
Materials and methods: To concurrently examine these phenomena, previous work has successfully considered the application of learning classifier systems (LCSs), a flexible class of evolutionary algorithms that distributes learned associations over a population of rules. Subsequent work dealt with the inherent problems of knowledge discovery and interpretation within these algorithms, allowing for the characterization of heterogeneous patterns of association. Whereas these previous advancements were evaluated using complex simulation studies, this study applied these collective works to a 'real-world' genetic epidemiology study of bladder cancer susceptibility.
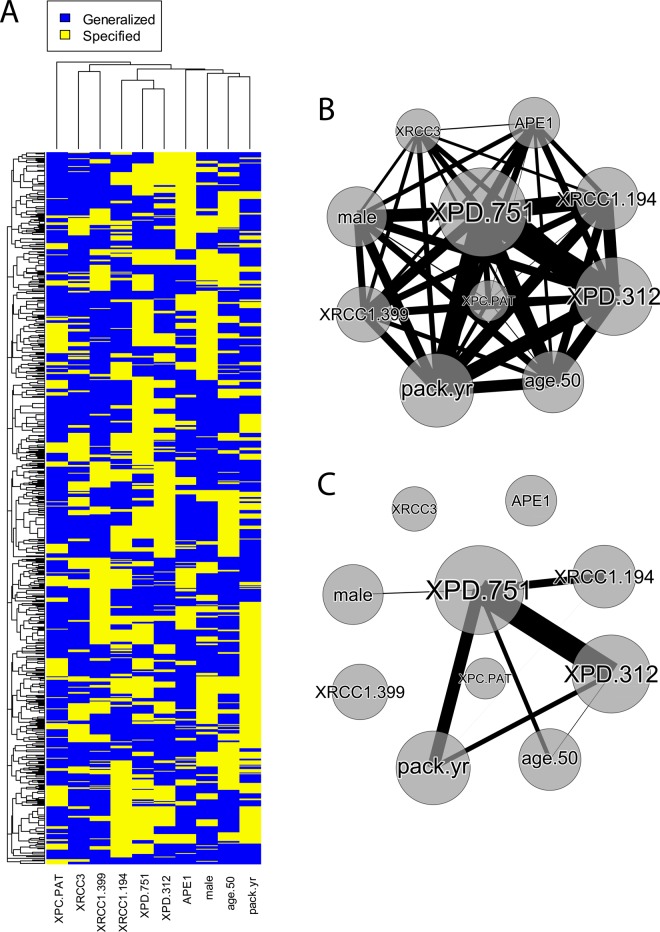
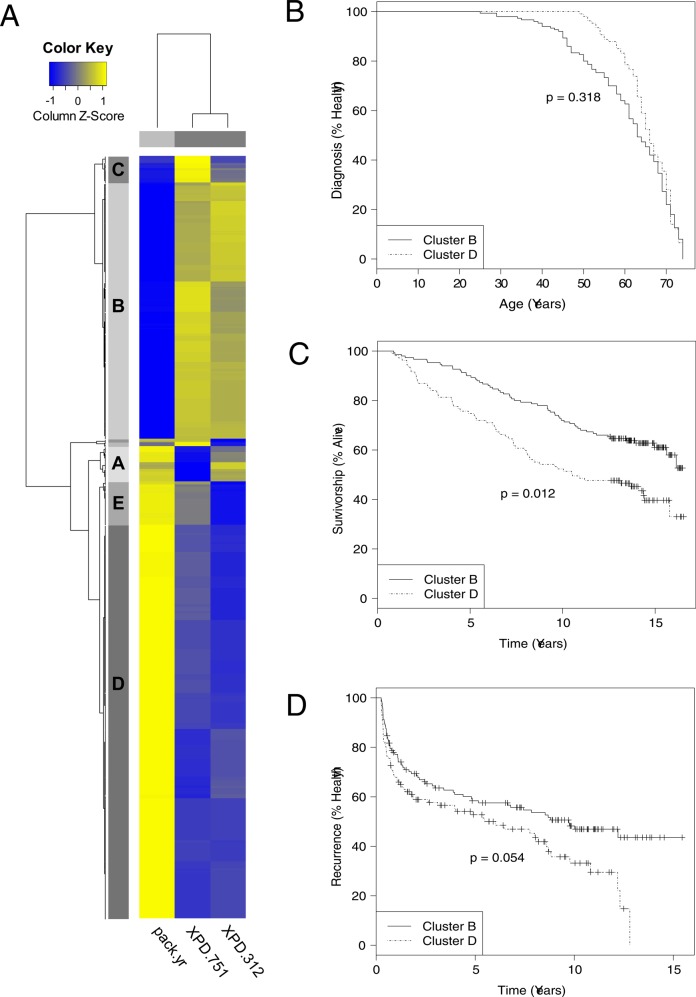
Results and discussion: We replicated the identification of previously characterized factors that modify bladder cancer risk--namely, single nucleotide polymorphisms from a DNA repair gene, and smoking. Furthermore, we identified potentially heterogeneous groups of subjects characterized by distinct patterns of association. Cox proportional hazard models comparing clinical outcome variables between the cases of the two largest groups yielded a significant, meaningful difference in survival time in years (survivorship). A marginally significant difference in recurrence time was also noted. These results support the hypothesis that an LCS approach can offer greater insight into complex patterns of association.
Conclusions: This methodology appears to be well suited to the dissection of disease heterogeneity, a key component in the advancement of personalized medicine.
Keywords: Bladder cancer; Epistasis; Heterogeneity; Learning Classifier System; Smoking; XPD.
Figures

Similar articles
-
Enabling personal genomics with an explicit test of epistasis.Pac Symp Biocomput. 2010:327-36. doi: 10.1142/9789814295291_0035. Pac Symp Biocomput. 2010. PMID: 19908385 Free PMC article.
-
Concordance of multiple analytical approaches demonstrates a complex relationship between DNA repair gene SNPs, smoking and bladder cancer susceptibility.Carcinogenesis. 2006 May;27(5):1030-7. doi: 10.1093/carcin/bgi284. Epub 2005 Nov 25. Carcinogenesis. 2006. PMID: 16311243
-
Improving strategies for detecting genetic patterns of disease susceptibility in association studies.Stat Med. 2008 Dec 30;27(30):6532-46. doi: 10.1002/sim.3431. Stat Med. 2008. PMID: 18837071
-
Machine learning approaches for the discovery of gene-gene interactions in disease data.Brief Bioinform. 2013 Mar;14(2):251-60. doi: 10.1093/bib/bbs024. Epub 2012 May 18. Brief Bioinform. 2013. PMID: 22611119 Review.
-
Genetic susceptibility to bladder cancer with an emphasis on gene-gene and gene-environmental interactions.Curr Opin Urol. 2008 Sep;18(5):493-8. doi: 10.1097/MOU.0b013e32830b88ff. Curr Opin Urol. 2008. PMID: 18670273 Review.
Cited by
-
ExSTraCS 2.0: Description and Evaluation of a Scalable Learning Classifier System.Evol Intell. 2015 Sep;8(2):89-116. doi: 10.1007/s12065-015-0128-8. Epub 2015 Apr 3. Evol Intell. 2015. PMID: 26417393 Free PMC article.
-
Machine learning applications in cancer prognosis and prediction.Comput Struct Biotechnol J. 2014 Nov 15;13:8-17. doi: 10.1016/j.csbj.2014.11.005. eCollection 2015. Comput Struct Biotechnol J. 2014. PMID: 25750696 Free PMC article. Review.
-
EMP2 induces cytostasis and apoptosis via the TGFβ/SMAD/SP1 axis and recruitment of P2RX7 in urinary bladder urothelial carcinoma.Cell Oncol (Dordr). 2021 Oct;44(5):1133-1150. doi: 10.1007/s13402-021-00624-x. Epub 2021 Aug 2. Cell Oncol (Dordr). 2021. PMID: 34339014
-
Two-Stage Approaches to Accounting for Patient Heterogeneity in Machine Learning Risk Prediction Models in Oncology.JCO Clin Cancer Inform. 2021 Sep;5:1015-1023. doi: 10.1200/CCI.21.00077. JCO Clin Cancer Inform. 2021. PMID: 34591602 Free PMC article.
-
Genetic heterogeneity: Challenges, impacts, and methods through an associative lens.Genet Epidemiol. 2022 Dec;46(8):555-571. doi: 10.1002/gepi.22497. Epub 2022 Aug 4. Genet Epidemiol. 2022. PMID: 35924480 Free PMC article. Review.
References
Publication types
MeSH terms
Grants and funding
- P42 ES007373/ES/NIEHS NIH HHS/United States
- CA5749/CA/NCI NIH HHS/United States
- T32 CA134286/CA/NCI NIH HHS/United States
- R01 LM010098/LM/NLM NIH HHS/United States
- LM010098/LM/NLM NIH HHS/United States
- LM009012/LM/NLM NIH HHS/United States
- AI59694/AI/NIAID NIH HHS/United States
- R01 CA057494/CA/NCI NIH HHS/United States
- P20 GM103534/GM/NIGMS NIH HHS/United States
- R01 AI059694/AI/NIAID NIH HHS/United States
- R01 LM009012/LM/NLM NIH HHS/United States
- R25 CA134286/CA/NCI NIH HHS/United States
- P20 RR024475/RR/NCRR NIH HHS/United States
LinkOut - more resources
Full Text Sources
Other Literature Sources
Medical
Research Materials
