. 2013 May;83(5):1007-19.
doi: 10.1124/mol.112.084319. Epub 2013 Feb 26.

Sensory nerve terminal mitochondrial dysfunction activates airway sensory nerves via transient receptor potential (TRP) channels

Affiliations

Sensory nerve terminal mitochondrial dysfunction activates airway sensory nerves via transient receptor potential (TRP) channels

Lika Nesuashvili et al. Mol Pharmacol. 2013 May.

Abstract

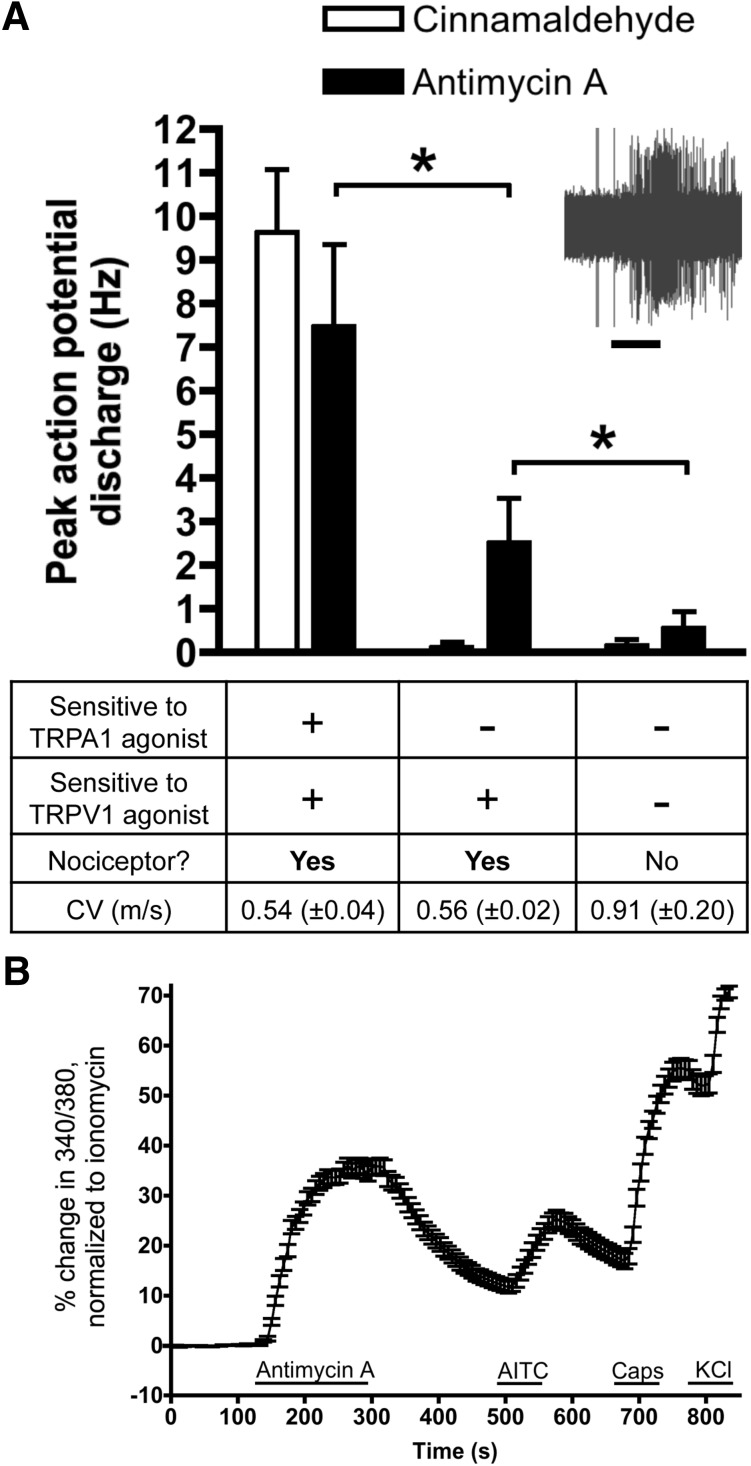
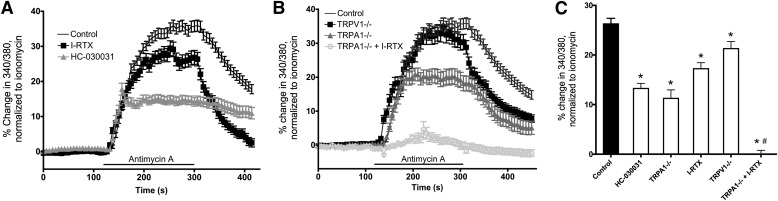
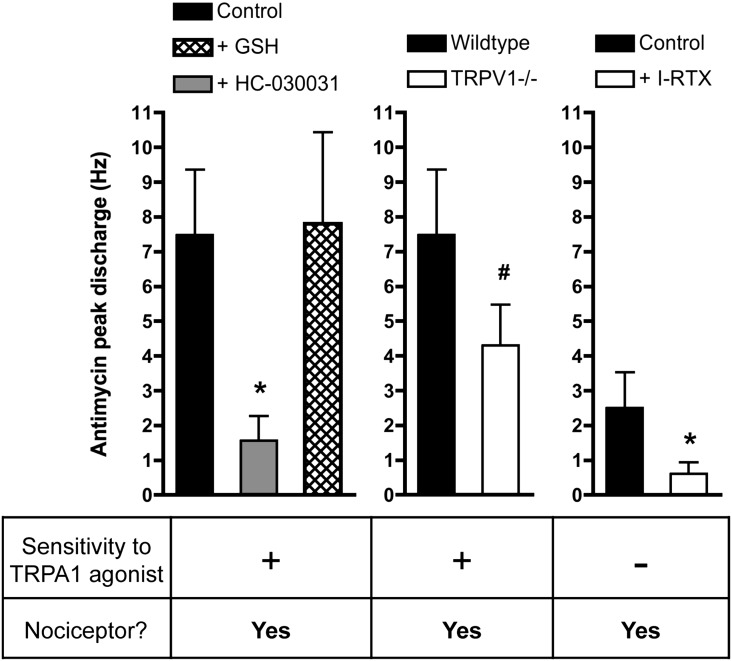
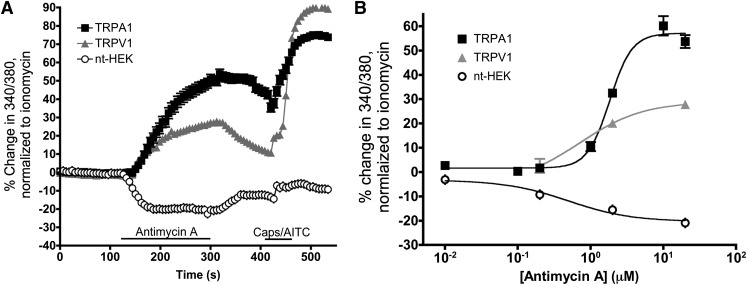
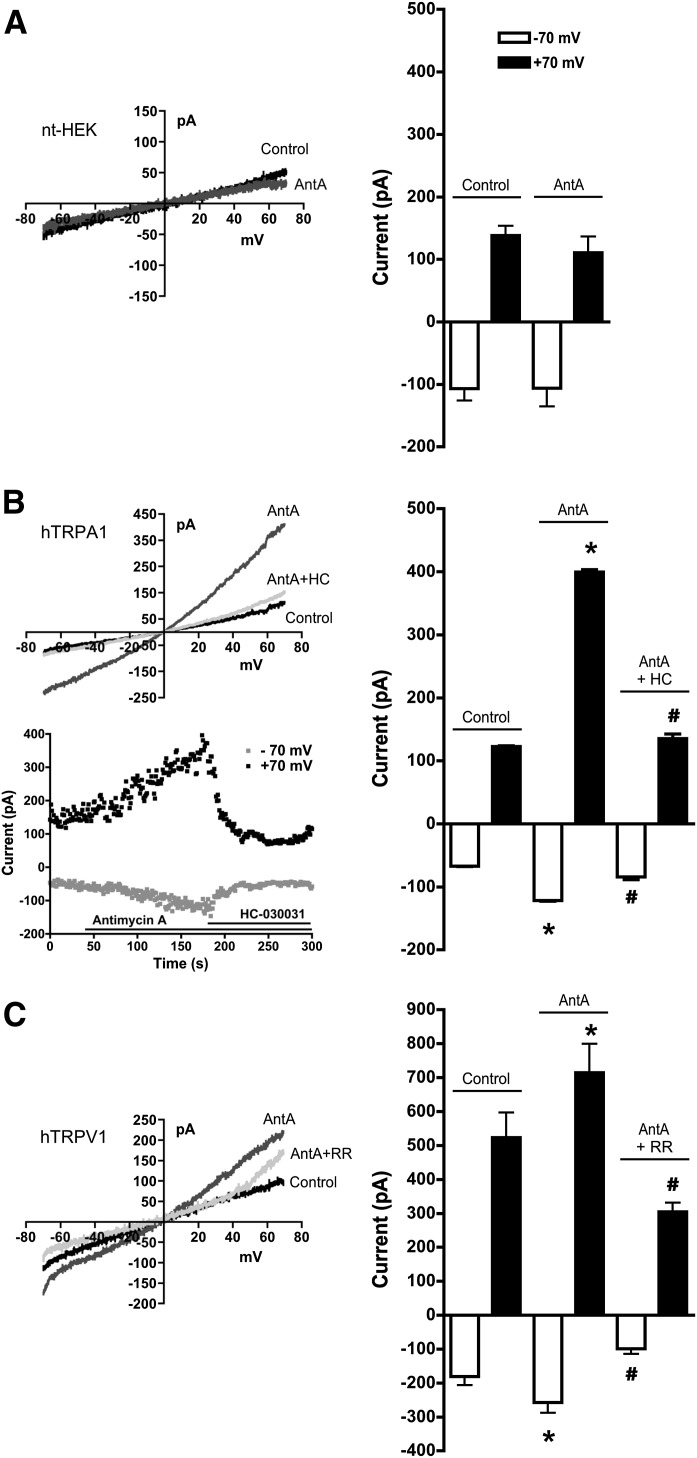
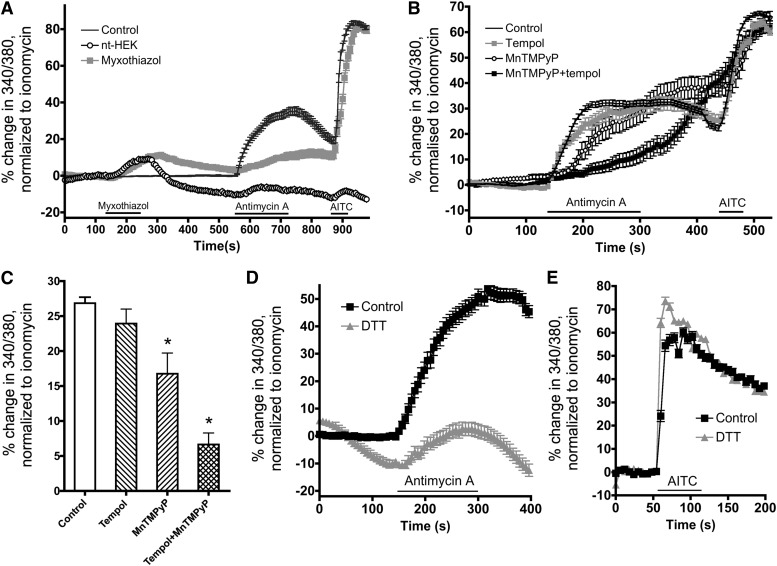
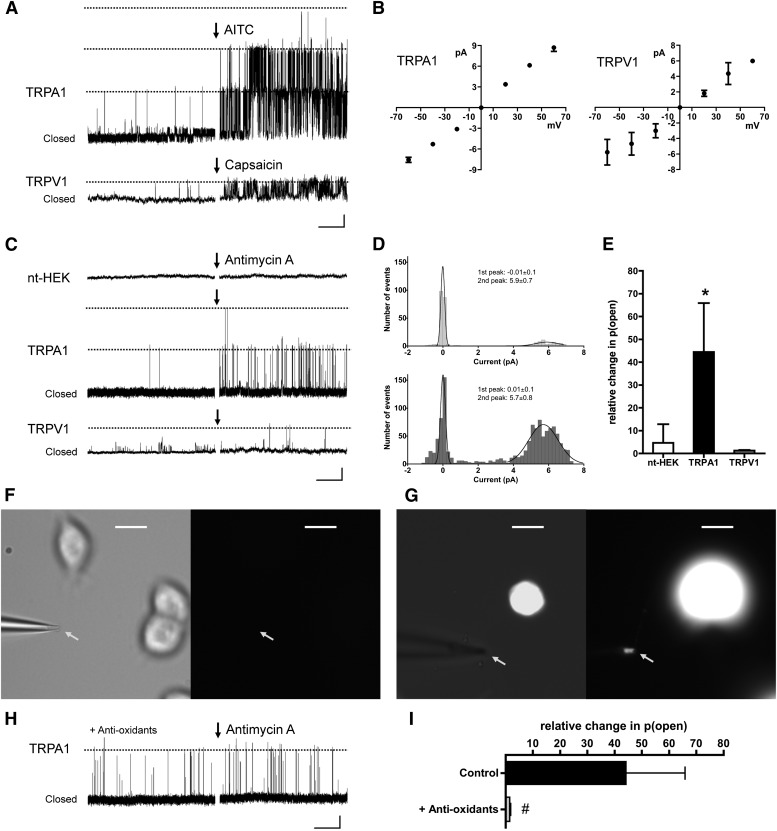
Mitochondrial dysfunction and subsequent oxidative stress has been reported for a variety of cell types in inflammatory diseases. Given the abundance of mitochondria at the peripheral terminals of sensory nerves and the sensitivity of transient receptor potential (TRP) ankyrin 1 (A1) and TRP vanilloid 1 (V1) to reactive oxygen species (ROS) and their downstream products of lipid peroxidation, we investigated the effect of nerve terminal mitochondrial dysfunction on airway sensory nerve excitability. Here we show that mitochondrial dysfunction evoked by acute treatment with antimycin A (mitochondrial complex III Qi site inhibitor) preferentially activated TRPA1-expressing "nociceptor-like" mouse bronchopulmonary C-fibers. Action potential discharge was reduced by the TRPA1 antagonist HC-030031. Inhibition of TRPV1 further reduced C-fiber activation. In mouse dissociated vagal neurons, antimycin A induced Ca(2+) influx that was significantly reduced by pharmacological inhibition or genetic knockout of either TRPA1 or TRPV1. Inhibition of both TRPA1 and TRPV1 was required to abolish antimycin A-induced Ca(2+) influx in vagal neurons. Using an HEK293 cell expression system, antimycin A induced concentration-dependent activation of both hTRPA1 and hTRPV1 but failed to activate nontransfected cells. Myxothiazol (complex III Qo site inhibitor) inhibited antimycin A-induced TRPA1 activation, as did the reducing agent dithiothreitol. Scavenging of both superoxide and hydrogen peroxide inhibited TRPA1 activation following mitochondrial modulation. In conclusion, we present evidence that acute mitochondrial dysfunction activates airway sensory nerves preferentially via TRPA1 through the actions of mitochondrially-derived ROS. This represents a novel mechanism by which inflammation may be transduced into nociceptive electrical signaling.


Figures

Fig. 1.
Fig. 1.
Antimycin A activates nociceptive vagal sensory neurons. (A) Mean ± S.E.M. peak action potential discharge from individual wild-type bronchopulmonary C-fibers in response to cinnamaldehyde (300 μM) and antimycin A (20 μM). Bronchopulmonary C-fibers were grouped according to their response to TRPA1 [cinnamaldehyde and/or AITC (300 μM)] and TRPV1 agonists (capsaicin, 1 μM). Mean ± S.E.M. conduction velocity (CV) is also shown. Sensitivity to TRP agonists and a conduction velocity <0.7 m/s was used as an indicator that the studied nerve is nociceptive (Kollarik et al., 2003; Nassenstein et al., 2008). *Significant difference in antimycin A response between groups (P < 0.05). Inset, representative trace showing action potential discharge to antimycin A (blocked line denotes 10-second application) in an individual TRPA1-expressing bronchopulmonary C-fiber. (B) Mean ± S.E.M. Ca2+ responses of dissociated wild-type vagal ganglia neurons (n = 298) in response to antimycin A (20 μM), AITC (100 μM), capsaicin (Caps, 1 μM), and KCl (75 mM). Blocked lines depict the duration of drug application.
Fig. 2.
Fig. 2.
Contribution of TRPA1 and TRPV1 to antimycin A-induced Ca2+ influx in vagal neurons. (A) Mean ± S.E.M. Ca2+ responses of dissociated wild-type vagal sensory neurons in response to antimycin A (20 μM). Control conditions (black line, n = 298), in the presence of 1 μM I-RTX (black squares, n = 165) and 30 μM HC-030031 (gray triangles, n = 171). (B) Mean ± S.E.M. Ca2+ responses in control wild-type neurons (black line, n = 298), TRPV1−/− neurons (black squares, n = 137), TRPA1−/− neurons (gray triangles, n = 81), and TRPA1−/− neurons in the presence of 1 μM I-RTX (gray rings, n = 50). Blocked lines depict the duration of antimycin A treatment. (C) Mean ± S.E.M. Ca2+ response of mouse vagal dissociated neurons during antimycin A treatment (228 seconds). *Significant reduction compared with control (P < 0.05); #significant reduction compared with TRPA1−/− neurons (P < 0.05).
Fig. 3.
Fig. 3.
Contribution of TRPA1 and TRPV1 to the activation of bronchopulmonary C-fibers by antimycin A. Mean ± S.E.M. peak action potential discharge from individual bronchopulmonary C-fibers in response to antimycin A (20 μM). Bronchopulmonary C-fibers were grouped according to their response to TRPA1 agonists [cinnamaldehyde (300 μM) and/or AITC (300 μM); data not shown]. Data in all columns only includes nociceptive wild-type and TRPV1−/− C-fibers, defined by conduction velocity and (only for wild-type C-fibers) sensitivity to capsaicin (1 μM; unpublished data). Left, responses in control wild-type TRPA1-expressing fibers (black column) are compared with responses in the presence of 30 μM HC-030031 (gray column) and 1 mM GSH (hatched column). Middle, responses in control wild-type TRPA1-expressing fibers (black column) are compared with responses in TRPA1-expressing TRPV1−/− C-fibers (white column). Right, responses in control wild-type fibers not expressing TRPA1 (black column) are compared with responses in the presence of 1 μM I-RTX. *Significant reduction compared with control (P < 0.05).
Fig. 4.
Fig. 4.
Antimycin A increases [Ca2+]i in hTRPA1- and hTRPV1-expressing cells. (A) Mean ± S.E.M. Ca2+ responses against time in HEKs transiently expressing hTRPA1 (black squares, n = 269), hTRPV1-HEK cells (gray triangles, n = 470), and nt-HEK cells (black rings, n = 334) in response to antimycin A (20 μM) and either AITC (TRPA1 and nt-HEK, 100 μM) or capsaicin (Caps, 1 μM). Blocked lines depict the duration of drug treatment. (B) Concentration-response relationships for antimycin A in HEKs transiently expressing hTRPA1 [black squares, n numbers (reading from lowest to highest concentration): 12, 22, 223, 125, 793, 118, 269); hTRPV1-HEK cells [gray triangles, n numbers (reading from lowest to highest concentration): 146, 912, 470]; and nt-HEK cells [black rings, n numbers (reading from lowest to highest concentration): 30, 120, 238, 334]. S.E.M may be hidden within the symbols. Data were fitted by nonlinear regression. EC50 for antimycin A-induced TRPA1 activation was determined to be 1.8 μM.
Fig. 5.
Fig. 5.
Antimycin A induces the activation of TRPA1 and TRPV1 channels. Whole-cell currents evoked under control conditions (black line) and during antimycin A (AntA; 10 μM, dark gray line) treatment. (A) nt-HEK cells: (left) representative I-V relationship and (right) mean ± S.E.M. currents at –70 (white bars) and +70 mV (black bars). (B) hTRPA1-expressing HEKs without and with HC-030031 (HC, 30 μM, light gray line): representative I-V relationship (upper left), representative current response [(lower left) –70 (gray squares) and +70 mV (black squares)] against time, and mean ± S.E.M. currents at –70 and +70 mV (right). (C) Perforated patch of hTRPV1-expressing HEKs without and with ruthenium red (RR, 30 μM, light gray line): representative I-V relationship (left) and mean ± S.E.M. currents at –70 and +70 mV (right). *Significant increase in currents compared with control conditions (P < 0.05); #significant reduction by inhibitor (P < 0.05).
Fig. 6.
Fig. 6.
Antimycin A activates TRPA1 indirectly via the actions of mitochondrially-derived ROS. (A, B) Mean ± S.E.M. Ca2+ responses against time in response to antimycin A (2 μM) and AITC (100 μM). (A) Data include HEKs transiently expressing hTRPA1 without (black line, n = 103) and with pretreatment with myxothiazol (200 nM) (gray squares, n = 137), and nt-HEK cells with pretreatment with myxothiazol (black rings, n = 68). (B) Data include HEKs transiently expressing hTRPA1 under control conditions (black line, n = 628), and with pretreatment of tempol (gray squares, 1 mM, n = 213), MnTMPyP (black rings, 50 μM, n = 58), or a combination of tempol and MnTMPyP (black squares, n = 55). (C) Mean ± S.E.M. Ca2+ response of HEKs transiently expressing hTRPA1 to antimycin A during tempol/MnTMPyP treatments (180 seconds). *Significant reduction compared with control (P < 0.05). (D) Mean ± S.E.M. Ca2+ responses of HEKs transiently expressing hTRPA1 in response to antimycin A (20 μM) in control conditions (black squares, n = 269) and in the presence of DTT (1 mM, gray triangles, n = 266). (E) Mean ± S.E.M. Ca2+ responses of HEKs transiently expressing hTRPA1 in response to AITC (100 μM) in control conditions (black squares, n = 104) and in the presence of DTT (10 mM, gray triangles, n = 168). Blocked lines depict the duration of drug treatment.
Fig. 7.
Fig. 7.
Antimycin A evokes single-channel TRPA1 currents in inside-out patches due to the presence of mitochondria in excised patches. (A) Representative recordings of single-channel activities in inside-out patches held at +40 mV from HEK cells transiently expressing hTRPA1 (top, three channels) and hTRPV1 (bottom, 1 channel) before and after exposure to AITC (10 μM) or capsaicin (300 nM). Dotted lines indicate currents through a single ion channel. Marker denotes 2 pA and 2 seconds. (B) Mean ± S.E.M. I-V relationship for individual TRPA1 (n = 13, left) and TRPV1 single channel recordings (n = 4, right) derived from 100-ms voltage steps under control conditions. (C) Representative single-channel activities in response to antimycin A (10 μM) in inside-out patches held at +40 mV from nt-HEK cells (top) and HEK cells expressing hTRPA1 (middle, two channels) or hTRPV1 (bottom, 1 channel). Dotted lines indicate currents through a single-ion channel. Marker denotes 2 pA and 2 seconds. (D) Representative current amplitude histograms of an inside-out patch containing a single TRPA1 channel before (top) and after antimycin A (bottom). Data fitted by Gaussian distribution (mean ± S.D. indicated). (E) Mean ± S.E.M. relative change in channel opening probability in response to antimycin A. *Significant increase compared with nt-HEK (P < 0.05). (F and G) Representative images of inside-out excised patches from HEK293 cells. Arrow indicates the location of the patch (note that the patch is in focus but in a different focal plane to neighboring cells). Line denotes 15 μm. (F) Inside-out patch from unlabeled nt-HEK cell in brightfield (left) and under rhodamine fluorescence (right). Note the lack of fluorescence in the patch. (G) Rhodamine fluorescence of patch pipette before (left, combination of brightfield and fluorescence images) and after (right, fluorescence image only) inside-out patch excision from nt-HEK cell labeled with MitoTracker Orange (500 ng/ml). Note the presence of mitochondria in the patch. (H) Representative single-channel activities in the presence of a combination of tempol (100 μM), SOD (10 units/ml), and catalase (100 units/ml) in response to antimycin A (10 μM) from an inside-out patch from a HEK cell expressing hTRPA1 (1 channel). Dotted lines indicate currents through a single-ion channel. Marker denotes 2 pA and 2 seconds. (I) mean ± S.E.M. relative change in TRPA1 channel opening probability in response to antimycin A, without and with antioxidant combination treatment. #Significant decrease compared with control antimycin A responses (P < 0.05).

Similar articles

Cited by

References

    1. Aguilera-Aguirre L, Bacsi A, Saavedra-Molina A, Kurosky A, Sur S, Boldogh I. (2009) Mitochondrial dysfunction increases allergic airway inflammation. J Immunol 183:5379–5387 - PMC - PubMed
    1. Andersson DA, Gentry C, Moss S, Bevan S. (2008) Transient receptor potential A1 is a sensory receptor for multiple products of oxidative stress. J Neurosci 28:2485–2494 - PMC - PubMed
    1. Andrè E, Campi B, Materazzi S, Trevisani M, Amadesi S, Massi D, Creminon C, Vaksman N, Nassini R, Civelli M, et al. (2008) Cigarette smoke-induced neurogenic inflammation is mediated by alpha,beta-unsaturated aldehydes and the TRPA1 receptor in rodents. J Clin Invest 118:2574–2582 - PMC - PubMed
    1. Aroor AR, Mandavia C, Ren J, Sowers JR, Pulakat L. (2012) Mitochondria and oxidative stress in the cardiorenal metabolic syndrome. Cardiorenal Med 2:87–109 - PMC - PubMed
    1. Bautista DM, Jordt SE, Nikai T, Tsuruda PR, Read AJ, Poblete J, Yamoah EN, Basbaum AI, Julius D. (2006) TRPA1 mediates the inflammatory actions of environmental irritants and proalgesic agents. Cell 124:1269–1282 - PubMed

Publication types

MeSH terms

LinkOut - more resources