. 2013 Apr;41(7):4036-48.
doi: 10.1093/nar/gkt100. Epub 2013 Feb 26.

Coactivators enable glucocorticoid receptor recruitment to fine-tune estrogen receptor transcriptional responses

Affiliations

Coactivators enable glucocorticoid receptor recruitment to fine-tune estrogen receptor transcriptional responses

Michael J Bolt et al. Nucleic Acids Res. 2013 Apr.

Abstract

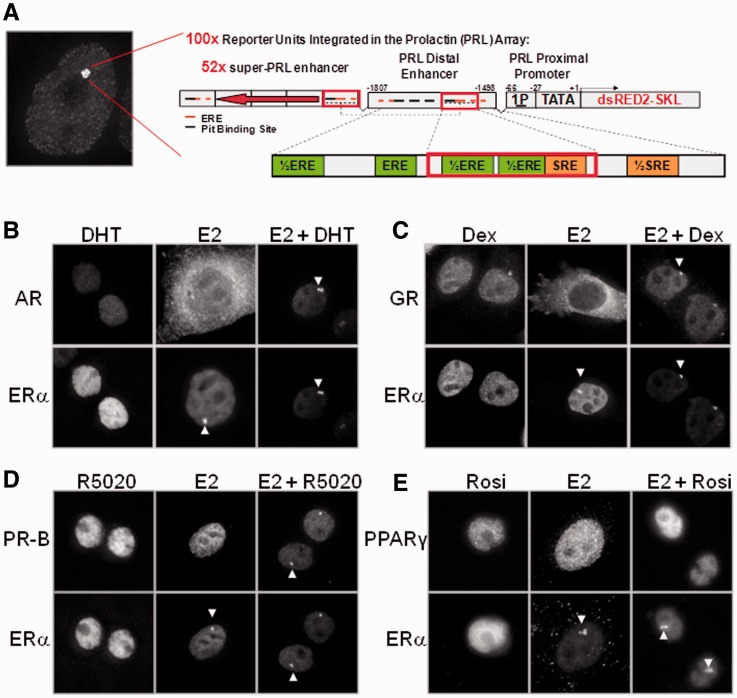
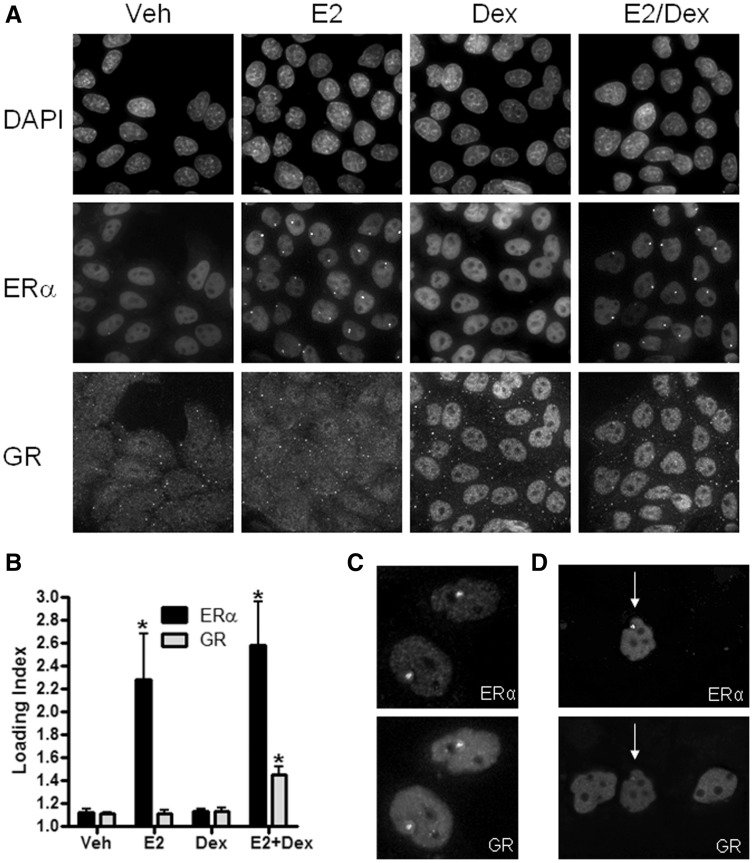
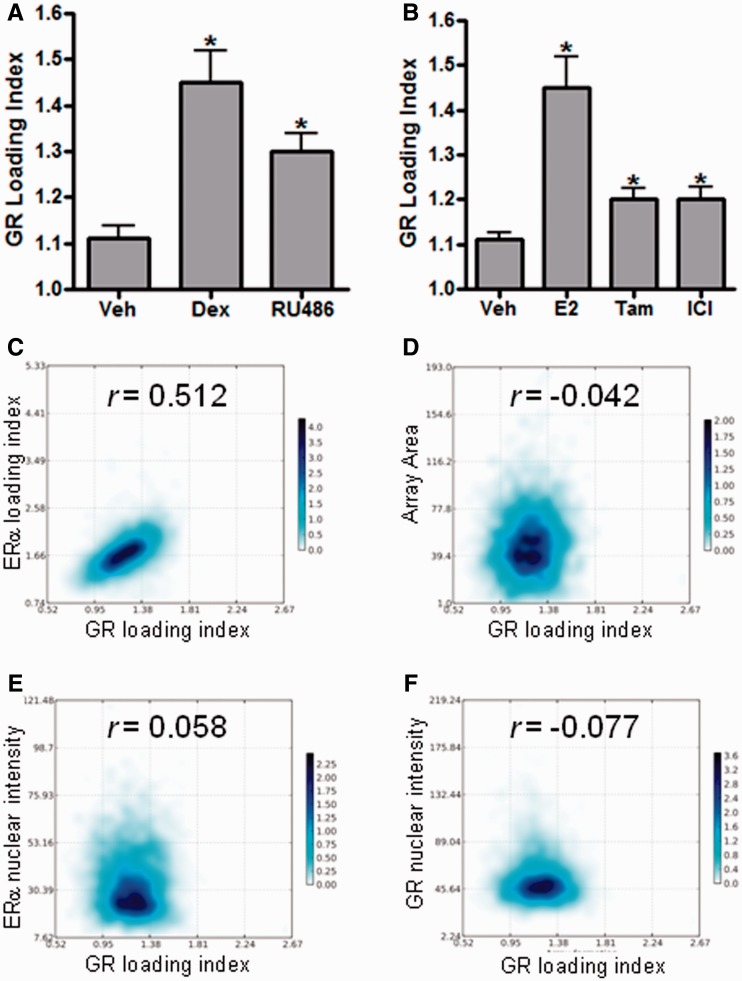
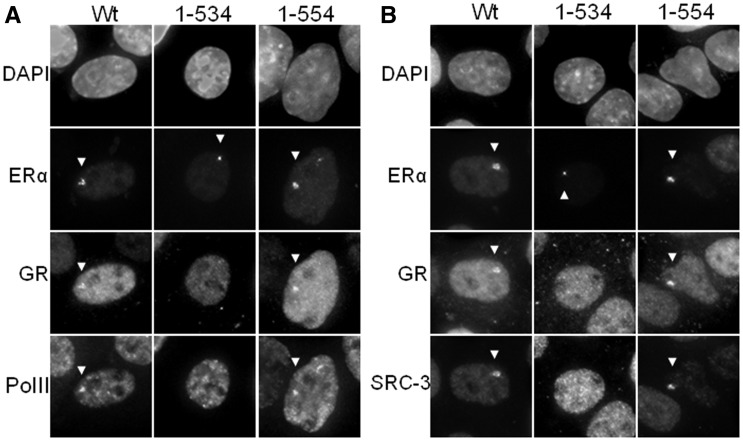
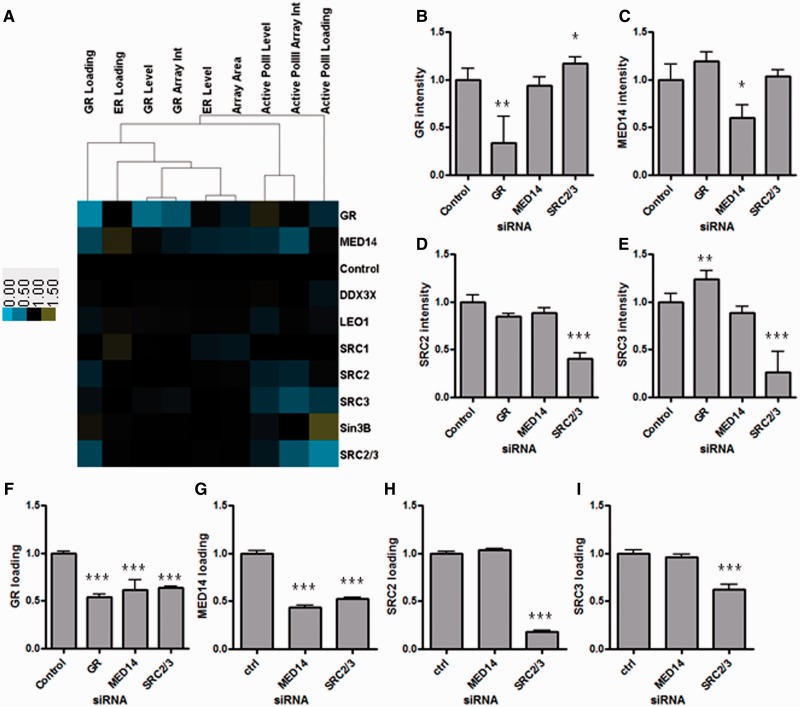
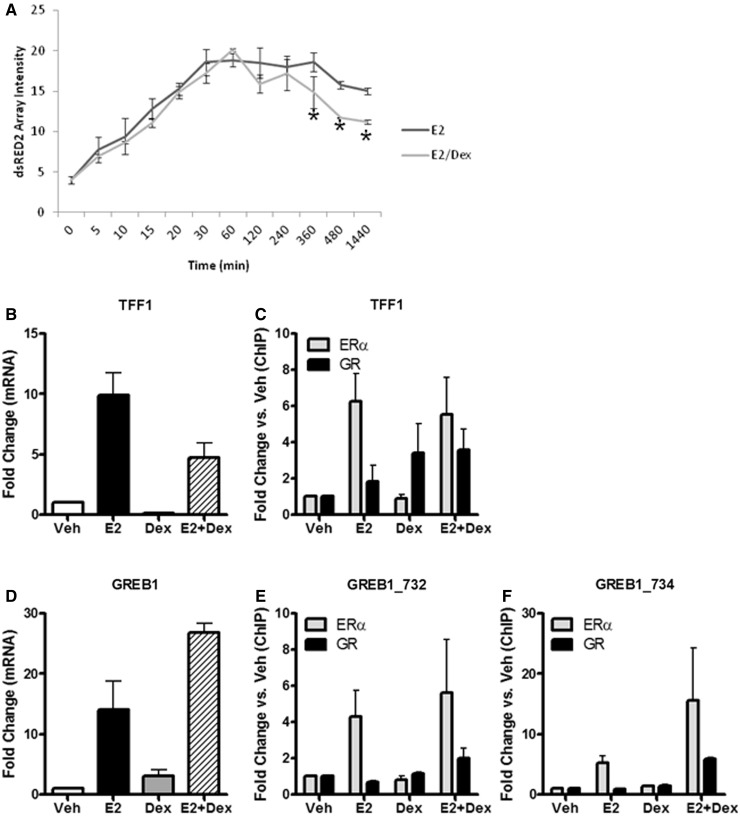
Nuclear receptors (NRs) are central regulators of pathophysiological processes; however, how their responses intertwine is still not fully understood. The aim of this study was to determine whether and how steroid NRs can influence each other's activity under co-agonist treatment. We used a unique system consisting of a multicopy integration of an estrogen receptor responsive unit that allows direct visualization and quantification of estrogen receptor alpha (ERα) DNA binding, co-regulator recruitment and transcriptional readout. We find that ERα DNA loading is required for other type I nuclear receptors to be co-recruited after dual agonist treatment. We focused on ERα/glucocorticoid receptor interplay and demonstrated that it requires steroid receptor coactivators (SRC-2, SRC-3) and the mediator component MED14. We then validated this cooperative interplay on endogenous target genes in breast cancer cells. Taken together, this work highlights another layer of mechanistic complexity through which NRs cross-talk with each other on chromatin under multiple hormonal stimuli.


Figures

Figure 1.
Figure 1.
Type I NRs localize to the PRL array only under dual ligand conditions. (A) Schematic representation of the PRL array that was stably integrated into the PRL-HeLa array cell line along with GFP-ERα. (B) Images of transfected ERα (bottom row) and AR (top row) in PRL HeLa cells treated with 10 nM DHT, 10 nM E2 or E2 + DHT. (C) Images of transfected ERα (bottom row) and GR (top row) in PRL HeLa cells treated with 100 nM Dex, 10 nM E2 or E2 + Dex. (D) Images of transfected ERα (bottom row) and PR-B (top row) in PRL HeLa cells treated with 10 nM R5020, 10 nM E2 or E2 + R5020. (E). Images of transfected ERα (bottom row) and PPARγ (top row) in PRL-HeLa cells treated with 10 nM Rosi, 10 nM E2 or E2 + Rosi. White arrows indicate the location of NR loading onto the PRL array.
Figure 2.
Figure 2.
Endogenous GR localizes to the PRL array under dual agonist conditions. (A) Representative fields of PRL-HeLa:GFP-ERα cells treated with 5% EtOH (veh), 10 nM E2, 100 nM Dex or 10 nM E2 + 100 nM Dex, showing DAPI, GFP-ERα and GR staining. (B) Quantification of ERα and GR loading index (mean intensity of signal at array/mean intensity of signal in the nucleoplasm) using PipelinePilot Image Analysis software. *P < 0.05. More than 1000 cells/condition were analyzed. (C) ERα and GR were transfected into PRL-HeLa cells treated with E2 + Dex and show localization to the PRL array. (D) mCherry-tagged ERα and GFP-tagged GR were transfected into PRL-HeLa cells and treated with E2 + Dex. Only the cell that has both ERα and GR shows GR localization to the PRL array (white arrows).
Figure 3.
Figure 3.
ERα, E2 and Dex are required for maximal GR loading. (A) Quantification of GR loading index in the presence of 10 nM E2 with either 5% EtOH (veh), 100 nM Dex or 100 nM RU486. (B) Quantification of GR loading index in the presence of 100 nM Dex with vehicle, 10 nM E2, 10 nM Tam or 100 nM ICI. *P < 0.05 compared with veh treatment. (C–F) Single-cell scatter plot of GR loading index (x-axis) with ERα loading index (C), array area (D), ERα nuclear intensity (E) or GR nuclear intensity (F) on the y-axis. Values above each plot are correlation coefficients quantified using Pearson’s product moment.
Figure 4.
Figure 4.
ERα mutants demonstrate importance of ERα helix-12 in GR recruitment. (A and B) GFP-tagged ERα mutants (full length, amino acids 1–534 or amino acids 1–554) were transfected along with mCherry-tagged GR into PRL-HeLa cells and treated with E2 + Dex for 30 min. Cells were labeled with antibody targeting RNA polymerase II (A) or SRC-3 (B). White arrows indicate the location of NR, SRC-3 or RNA polymerase II loading onto the PRL array.
Figure 5.
Figure 5.
MED14, SRC-2 and SRC-3 mediate the recruitment of GR to the PRL array. (A) Heat map showing effects of siRNA knockdown of multiple factors on features of the PRL array system, including GR loading, active RNA polymerase II loading and ER loading. (B) Quantification of GR nuclear intensity (normalized to control siRNA) after 72 h siRNA knockdown of GR, MED14 and SRC-2/-3 in HeLa-PRL:GFP-ERα cells treated with 10 nM E2 + 100 nM Dex for 30 min. (C) Quantification of MED14 nuclear intensity (normalized to control siRNA). (D) Quantification of SRC-2 nuclear intensity (normalized to control siRNA) treated as described earlier in the text. (E) Quantification of SRC-3 nuclear intensity (normalized to control siRNA). (F) Quantification of GR loading (normalized to control siRNA) after 72 h siRNA knockdown of GR, MED14 or SRC-2/-3 in HeLa-PRL:GFP-ERα cells treated with 10 nM E2 + 100 nM Dex for 30 min. (G) Quantification of MED14 loading (normalized to control siRNA) after 72 h siRNA knockdown of MED14, or SRC-2/-3 in HeLa-PRL:GFP-ERα cells treated with 10 nM E2 + 100 nM Dex for 30 min. (H) Quantification of SRC-2 loading (normalized to control siRNA) after 72 h siRNA knockdown of MED14, or SRC-2/-3 in HeLa-PRL:GFP-ERα cells treated with 10 nM E2 + 100 nM Dex for 30 min. (I) Quantification of SRC-3 loading (normalized to control siRNA) after 72 h siRNA knockdown of MED14, or SRC-2/-3 in HeLa-PRL:GFP-ERα cells treated with 10 nM E2 + 100 nM Dex for 30 min (*P < 0.05; **P < 0.005; *** P < 0.0005).
Figure 6.
Figure 6.
ERα/GR cross-talk effects transcriptional output in PRL array and MCF-7 cell systems. (A) Time course of dsRED2 mRNA production at the PRL array when treated with 10 nM E2 or 10 nM E2 + 100 nM Dex and measured by RNA FISH. *P < 0.05 versus E2. (B) TFF1 mRNA levels were measured by qPCR when treated for 24 h with 5% EtOH (V), 10 nM E2 (E), 100 nM Dex (D) or 10 nM E2 + 100 nM Dex (E + D). (C) ChIP assay showing ERα (gray) and GR (black) recruitment to the TFF1 enhancer region after 45 min of treatments mentioned in (B). Data are normalized to vehicle treatment. (D) GREB1 mRNA levels were measured by qPCR after 24 h of treatment. (E and F) ChIP assay showing ERα (gray) and GR (black) recruitment to two enhancer regions (732 and 734, respectively) of the GREB1 genomic locus after 45-min treatments.

References

    1. Horner-Glister E, Maleki-Dizaji M, Guerin CJ, Johnson SM, Styles J, White IN. Influence of oestradiol and tamoxifen on oestrogen receptors-alpha and -beta protein degradation and non-genomic signalling pathways in uterine and breast carcinoma cells. J. Mol. Endocrinol. 2005;35:421–432. - PubMed
    1. Ogawa S, Eng V, Taylor J, Lubahn DB, Korach KS, Pfaff DW. Roles of estrogen receptor-alpha gene expression in reproduction-related behaviors in female mice. Endocrinology. 1998;139:5070–5081. - PubMed
    1. Rudnik V, Sanyal A, Syed FA, Monroe DG, Spelsberg TC, Oursler MJ, Khosla S. Loss of ERE binding activity by estrogen receptor-alpha alters basal and estrogen-stimulated bone-related gene expression by osteoblastic cells. J. Cell. Biochem. 2008;103:896–907. - PubMed
    1. Tobias JH, Steer CD, Vilarino-Guell C, Brown MA. Estrogen receptor alpha regulates area-adjusted bone mineral content in late pubertal girls. J. Clin. Endocrinol. Metab. 2007;92:641–647. - PubMed
    1. Pike AC. Lessons learnt from structural studies of the oestrogen receptor. Best Pract. Res. 2006;20:1–14. - PubMed

Publication types

MeSH terms