. 2013 Feb;25(2):662-76.
doi: 10.1105/tpc.112.107326. Epub 2013 Feb 26.

Progressive transverse microtubule array organization in hormone-induced Arabidopsis hypocotyl cells

Affiliations

Progressive transverse microtubule array organization in hormone-induced Arabidopsis hypocotyl cells

Laura Vineyard et al. Plant Cell. 2013 Feb.

Abstract

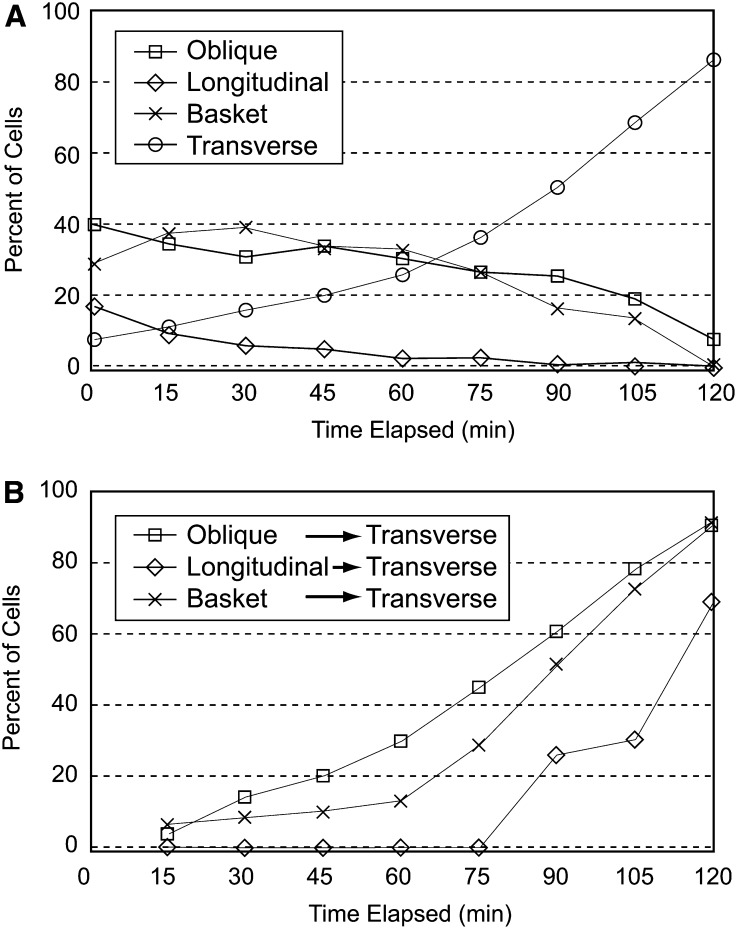
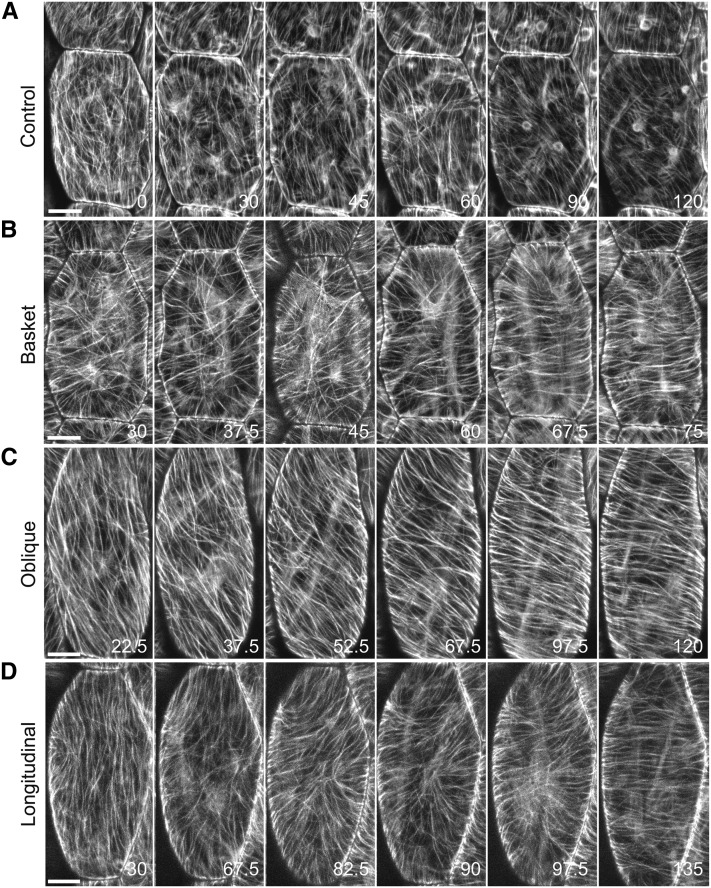
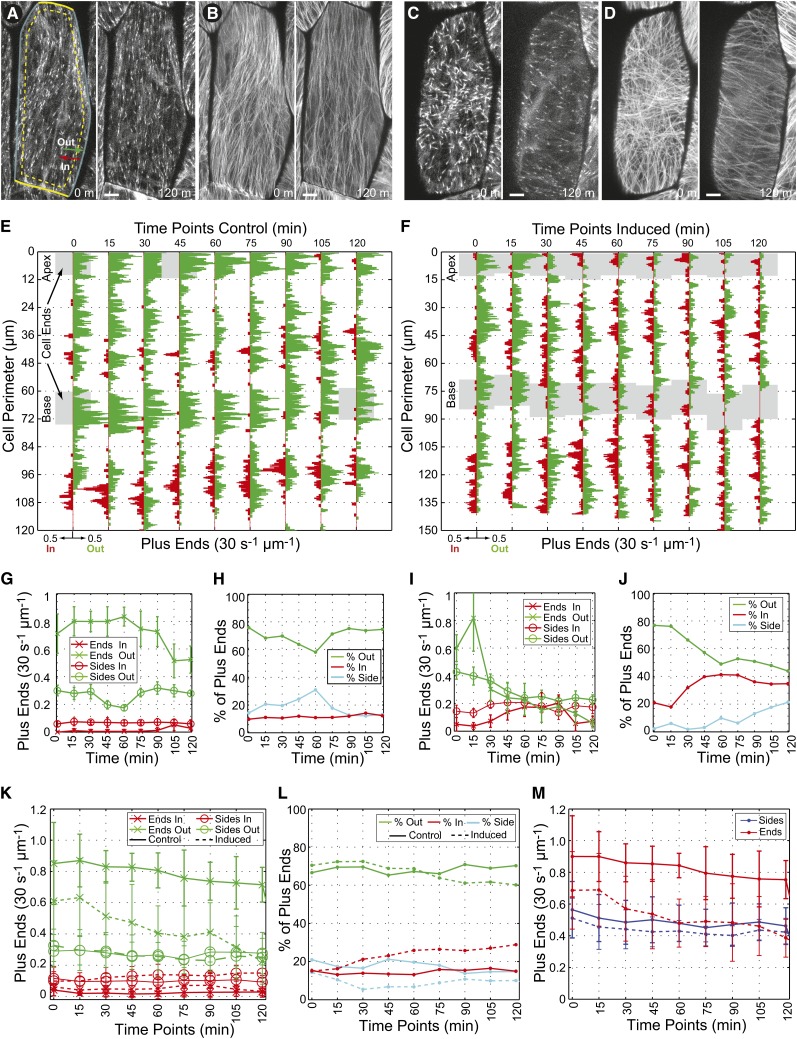
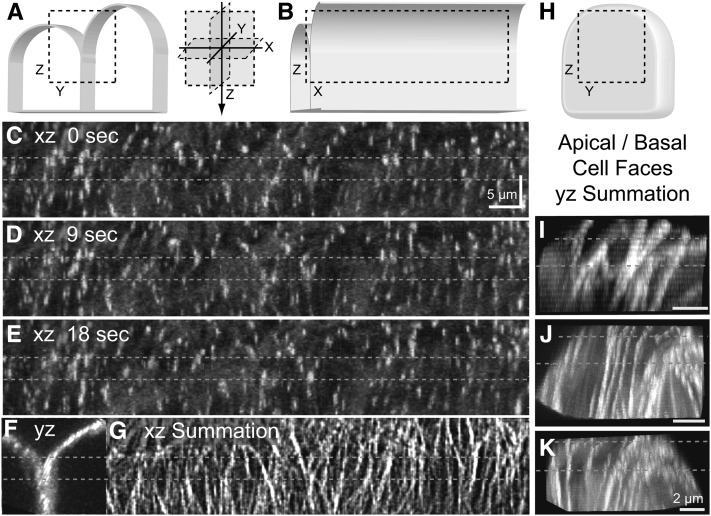
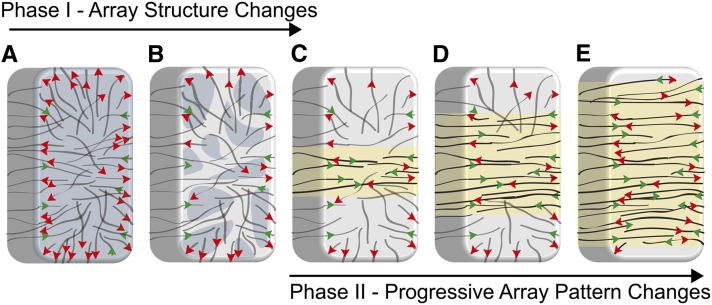
The acentriolar cortical microtubule arrays in dark-grown hypocotyl cells organize into a transverse coaligned pattern that is critical for axial plant growth. In light-grown Arabidopsis thaliana seedlings, the cortical array on the outer (periclinal) cell face creates a variety of array patterns with a significant bias (>3:1) for microtubules polymerizing edge-ward and into the side (anticlinal) faces of the cell. To study the mechanisms required for creating the transverse coalignment, we developed a dual-hormone protocol that synchronously induces ∼80% of the light-grown hypocotyl cells to form transverse arrays over a 2-h period. Repatterning occurred in two phases, beginning with an initial 30 to 40% decrease in polymerizing plus ends prior to visible changes in the array pattern. Transverse organization initiated at the cell's midzone by 45 min after induction and progressed bidirectionally toward the apical and basal ends of the cell. Reorganization corrected the edge-ward bias in polymerization and proceeded without transiting through an obligate intermediate pattern. Quantitative comparisons of uninduced and induced microtubule arrays showed a limited deconstruction of the initial periclinal array followed by a progressive array reorganization to transverse coordinated between the anticlinal and periclinal cell faces.


Figures

Figure 1.
Figure 1.
GA4/IAA-Induced Cortical Microtubule Array Reorganization. (A) to (D) Confocal microscopy images of 6-d-old light-grown epidermal hypocotyl cells showing basket (A), longitudinal (B), oblique (C), and transverse (D) microtubule array organization in GFP:TUA6-expressing plants. Bars = 10 µm. (E) The percentage of epidermal hypocotyl cells exhibiting each array organization class for seedlings imaged directly from germination plates (untreated) or after 2 h in liquid culture with the associated treatment condition (bar pattern designations for array class displayed in [A] to [D]). (F) Box and whisker quartile plots for the percentage of cells with transverse arrays at 2 h including the mean value (filled circle) and outlying data (open circles) for each treatment. Number of observations for (E) and (F), as plants/cells, were as follows: untreated (26/827), half-strength MS (15/376), solvent (13/397), GA4 (19/477), IAA (19/478), GA4 + IAA (15/476). (G) The effect of all treatments on hypocotyl length was assayed by direct measurement of seedling hypocotyls after 72 h of continuous treatment. Bars represent mean values from >45 total plants pooled from three experiments for each treatment with variation displayed as the pooled sd.
Figure 2.
Figure 2.
Timing of Hormone-Induced Microtubule Array Reorganization. Epidermal hypocotyl cells (n = 196 cells across six plants) were imaged after induction with 10 µM IAA and 0.5 µM GA4 at 15-min intervals for 120 min. (A) The percentage of all cells exhibiting each array pattern class is plotted at each time interval. The percentage of cells with arrays classed as transverse shows an initially slow rise followed by a more rapid phase. (B) The relative percentage of each array class that has reorganized to a transverse orientation was plotted for arrays starting as oblique, longitudinal, or basket patterns. Cells with initially oblique (∼40% of cells) arrays transited to transverse slightly ahead of cells with basket (∼32% of cells) array forms and longitudinal arrays (∼18% of cells) were slightly delayed when compared with both basket and oblique.
Figure 3.
Figure 3.
Cortical Microtubule Reorganization from Basket, Oblique, or Longitudinal Patterns to Transverse over Time. Confocal image projections of GFP:TUA6-labeled microtubules in epidermal hypocotyl cells grown for 6 d in continuous light. Time in minutes. Bars = 10 µm in (A) to (D). (A) Selected images from a solvent control cell over 120 min of imaging. The array pattern changes over the course of observation but achieves no defined pattern of organization. (B) to (D) Plants treated with GA4 and IAA. (B) Cells with basket formed arrays are characterized by microtubules oriented perpendicular to the cell perimeter around the entire edge of the outer periclinal cell face. Transversely aligned microtubules appear across the middle of the cell between 45 and 60 min and progress toward the cell apex and base. Note the persistence of longitudinal microtubules at the cell apex and base. (C) Oblique arrays appeared to rotate into a transverse position, progressively creating arrays of shallower angle relative to the cell growth axis. The middle zone of the cell becomes transverse ahead of the apex and base (67.5 min), creating a transient sigmoidal shape for the array polymers prior to becoming transverse. (D) Reorganization of longitudinal arrays was characterized by the invasion of new microtubules from the lateral side faces of the cell (90 to 97.5 min) instead of the progressive shift to shallower angles.
Figure 4.
Figure 4.
Time-Lapse Imaging of GFP:AtEb1 in Hormone-Induced Cells Organizing into a Transverse Coalignment. Confocal imaging of control ([A] and [B]) and hormone-induced ([C] and [D]) hypocotyl cells expressing a GFP:AtEb1 transgene marking the polymerizing microtubule plus ends. A single time point (projection of 5-µm depth) from 0 and 120 min ([A] and [C]) is paired with a summation image (sum of 50 projected frames taken at 6-s intervals) from 0 and 120 min ([B] and [D]) to show the trajectory of the microtubule plus ends and the representative pattern of microtubule array organization. Bars = 3 µm in (A) to (D). The density and orientation of plus-end polymerization was measured at the perimeter of the outer periclinal array (outline and dashed contour in [A]) at 15-min intervals ([E] to [M]). A 5-min time-lapse image series was acquired at 5-s intervals every 15 min for 120 min where the position and number of GFP:AtEb1 spots entering (In), exiting (out), or moving parallel to a cell edge (Side) was recorded within the ∼3-µm space delimited by the dashed contour line. The mean number of GFP:AtEb1 spots (i.e., microtubule plus ends) per micrometer of cell perimeter per 30-s time interval moving out of (green) or into (red) the outer periclinal array in a control (E) and an induced (F) cell are plotted for each 15-min time point in the 2-h time-lapse series (cells in [A] to [D] depicted in [E] and [F]). The cell perimeter was made linear in (E) and (F) with the cell’s apex and base shaded (gray). Note the spreading of incoming plus ends (red) on the lateral sides of the cell and the loss of plus ends at the apical and basal ends for the induced cell (F). Data from a single control (E) or treated (F) cell plotted numerically to show the change in the mean density ([G] and [I]) of plus ends polymerizing out of (green) or into (red) the outer periclinal array at the lateral sides (o) or ends (x) of the cell. The percentage of all plus ends in each orientation through time counted per time point in a single control (H) and treated (J) cell. The mean number of plus ends moving out of (green) or into (red) the periclinal array per 30 s ± sd (K) aggregated from six control (solid lines) and six treated (dashed lines) cells. The percentage of all plus ends in each orientation through time (L) aggregated from six control ([L], solid lines) and six hormone-induced ([L], dashed lines) cells. Combined density of polymerizing plus ends (In + Out) for six control ([M], solid lines) and six treated ([M], dashed lines) at the cell’s lateral sides (blue) and ends (red).
Figure 5.
Figure 5.
Microtubule Polymerization Is Continuous between Periclinal and Anticlinal Hypocotyl Faces during Array Reorganization. (A) Schematic of two adjacent hypocotyl cells viewed end on (yz projection) indicating the cross section of the imaged region of the lateral cell junction (dashed box). (B) Rotation and cutaway of the schematic (xz projection) indicating the projected image volume used to assess the continuity of the microtubule polymerization trajectories in the lateral side faces of the cell. (C) to (E) Confocal images of GFP:Eb1 taken at sequential axial (z axis) positions were combined and reprojected from the side (xz projections as in [B]) to create time-lapse images of microtubule plus-end trajectories. (F) A rotation of the image data (yz projection as in [A]) indicating the position of the cell junction. Reference lines (dashed lines in [C] to [K]) bracket the cell junction. (G) A summation of 100 consecutive side projected images (xz projections as in [B]) taken at 3-s intervals indicating the track or trajectory for the microtubule plus ends polymerizing across the cell junction. (H) to (K) Summation images from time-lapse GFP:Eb1 data at the apical/basal cell face (schematic in [H]) for three cells at 60 min after hormone induction indicating continuous polymerization trajectories across trans-facial boundaries ([I] to [K]).
Figure 6.
Figure 6.
Depiction of Hormone-Induced Cortical Array Reorganization to a Transverse Pattern. Hypothetical hypocotyl cell with cortical microtubule array displayed (black lines) with polymerizing plus ends (arrowheads). (A) Initial array organization with 3:1 ratio of outward (red arrowheads) to inward (green arrowheads) polymerizing plus ends. (B) Hormone treatment induces a change in array structure observed as a decrease in the number of microtubule ends (mottled surface) on the outer periclinal cell face prior to significant changes to array pattern. (C) to (E) Transverse microtubules initially appear at the cell midzone ([C]; yellow surface) and organize progressively ([D] and [E]) from the midzone to the apex and base of the cell.

Similar articles

Cited by

References

    1. Allard J.F., Ambrose J.C., Wasteneys G.O., Cytrynbaum E.N. (2010a). A mechanochemical model explains interactions between cortical microtubules in plants. Biophys. J. 99: 1082–1090 - PMC - PubMed
    1. Allard J.F., Wasteneys G.O., Cytrynbaum E.N. (2010b). Mechanisms of self-organization of cortical microtubules in plants revealed by computational simulations. Mol. Biol. Cell 21: 278–286 - PMC - PubMed
    1. Ambrose C., Allard J.F., Cytrynbaum E.N., Wasteneys G.O. (2011). A CLASP-modulated cell edge barrier mechanism drives cell-wide cortical microtubule organization in Arabidopsis. Nat. Commun. 2: 430. - PMC - PubMed
    1. Baskin T.I. (2001). On the alignment of cellulose microfibrils by cortical microtubules: A review and a model. Protoplasma 215: 150–171 - PubMed
    1. Baskin T.I. (2005). Anisotropic expansion of the plant cell wall. Annu. Rev. Cell Dev. Biol. 21: 203–222 - PubMed

Publication types

LinkOut - more resources