. 2013 Mar;140(6):1171-83.
doi: 10.1242/dev.085654.

A membrane-associated β-catenin/Oct4 complex correlates with ground-state pluripotency in mouse embryonic stem cells

Affiliations

A membrane-associated β-catenin/Oct4 complex correlates with ground-state pluripotency in mouse embryonic stem cells

Fernando Faunes et al. Development. 2013 Mar.

Abstract

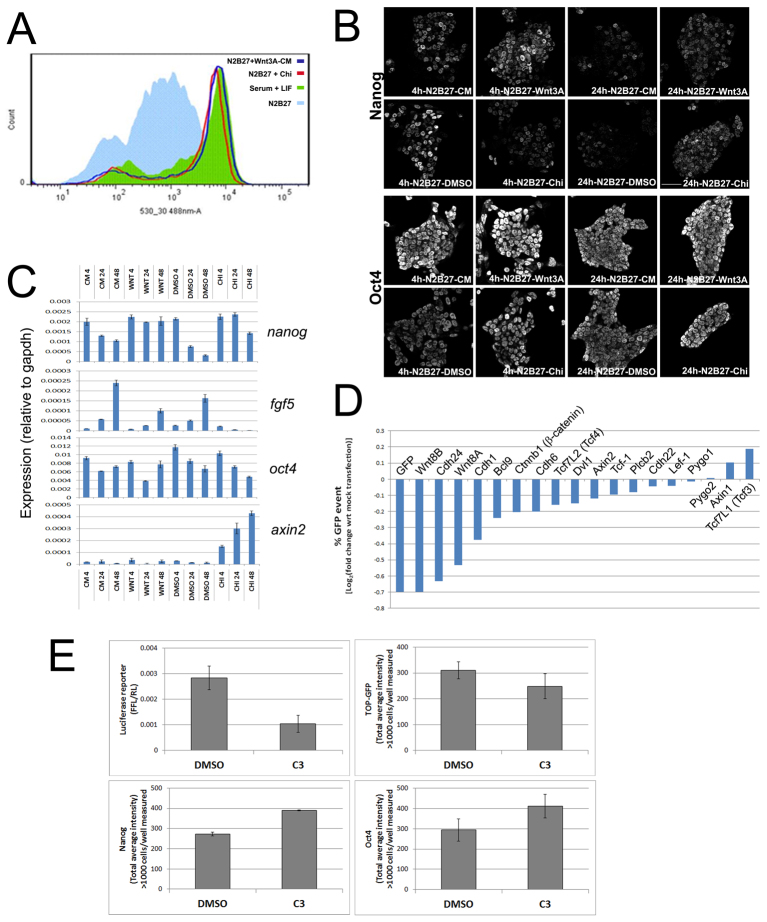
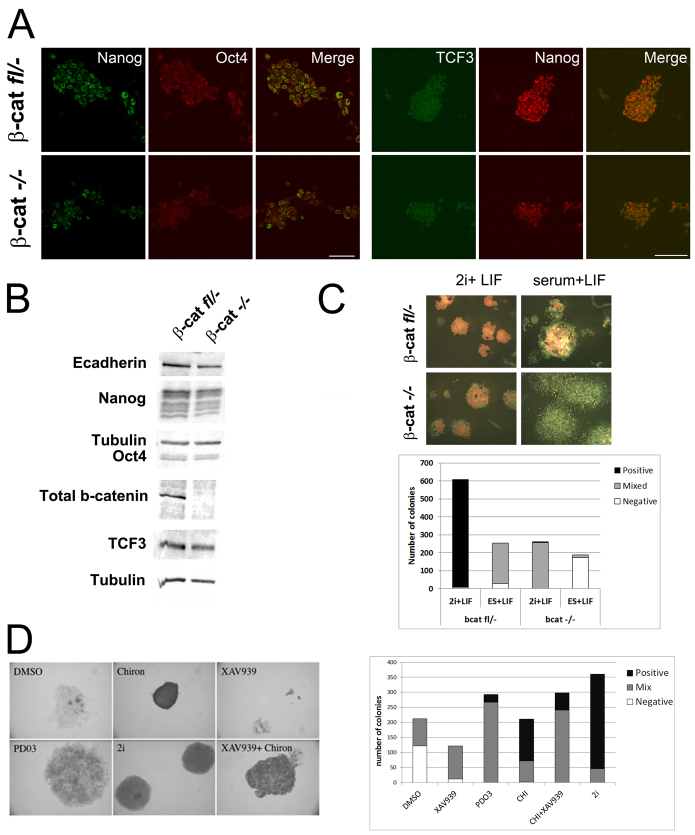
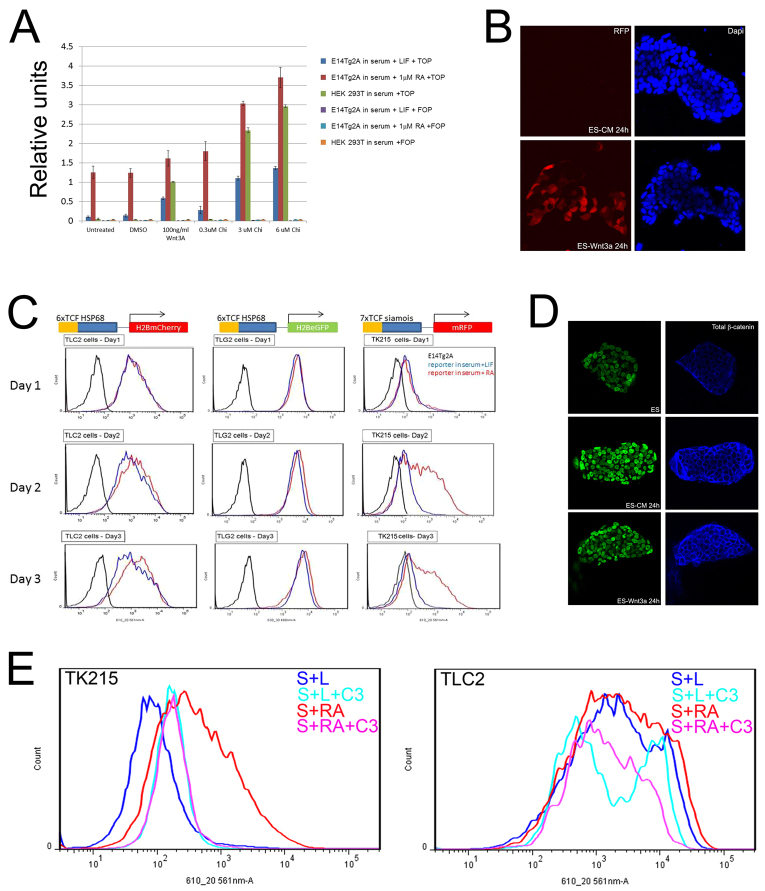
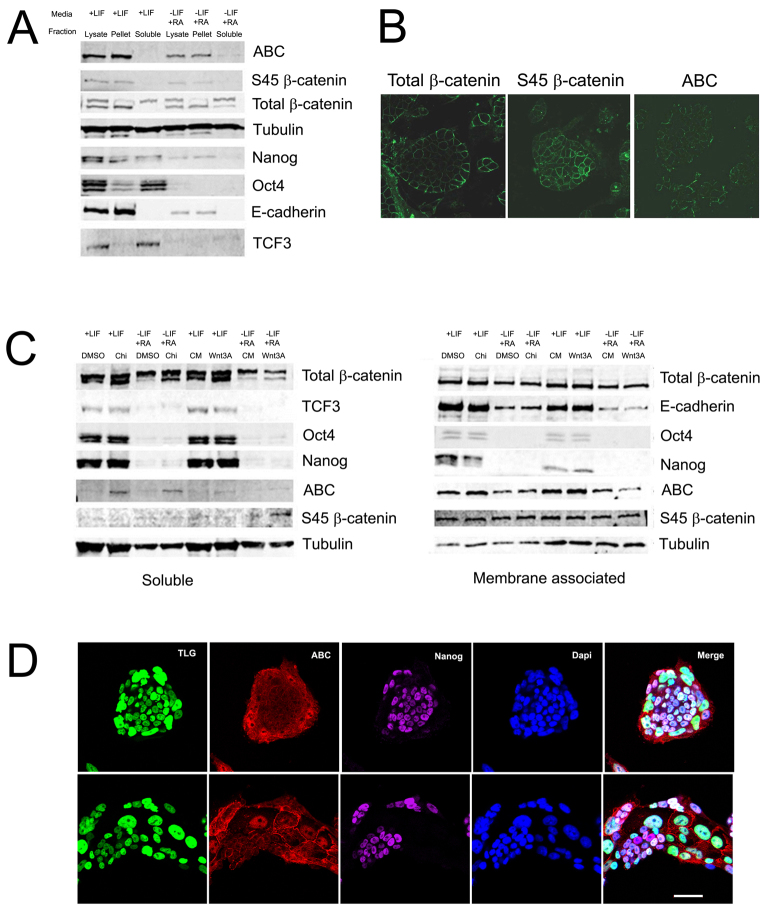
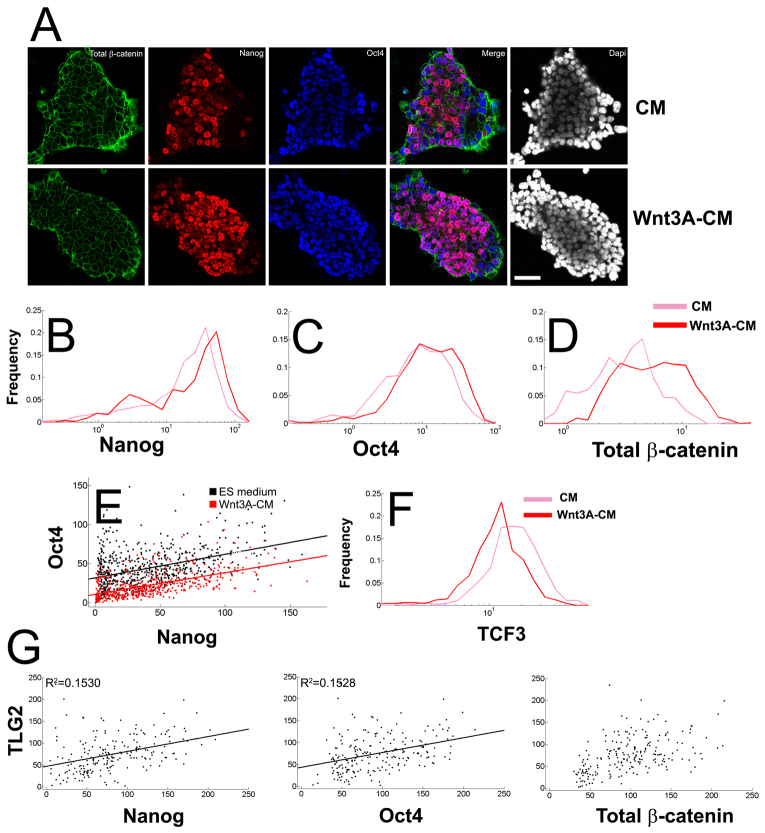
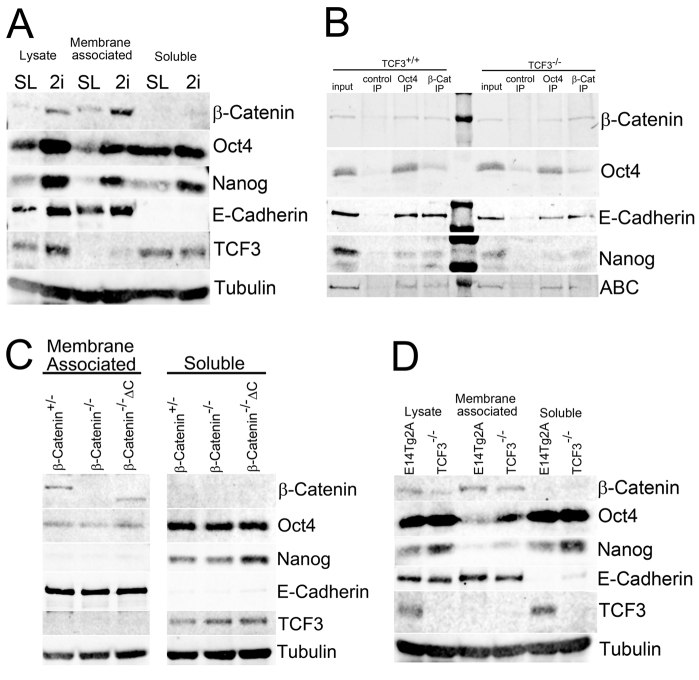
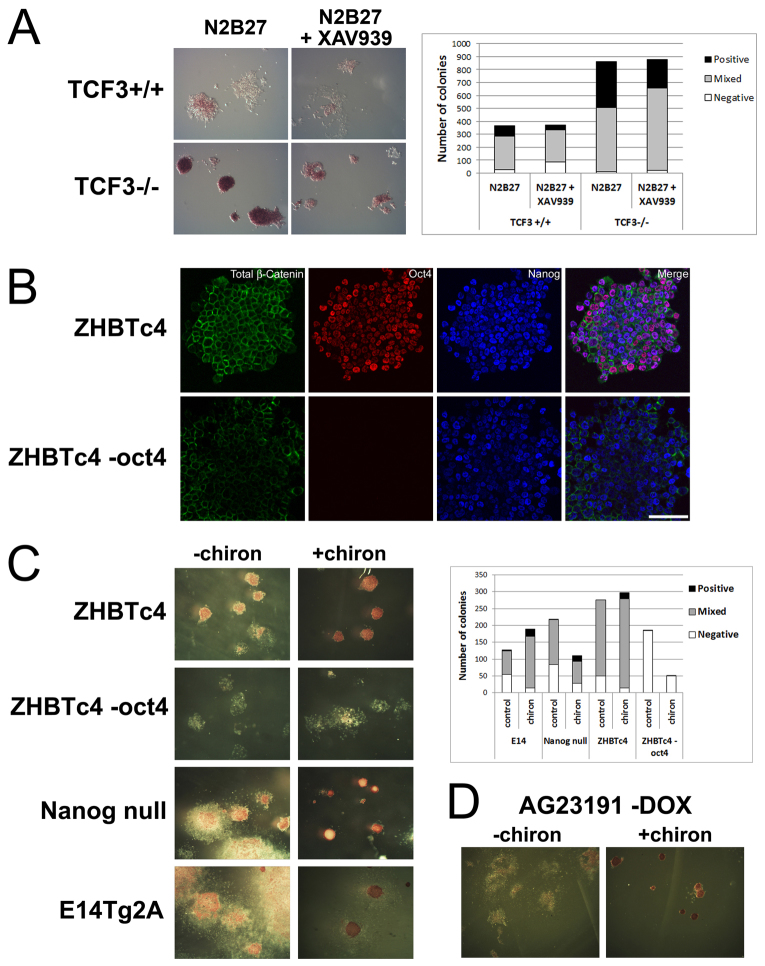
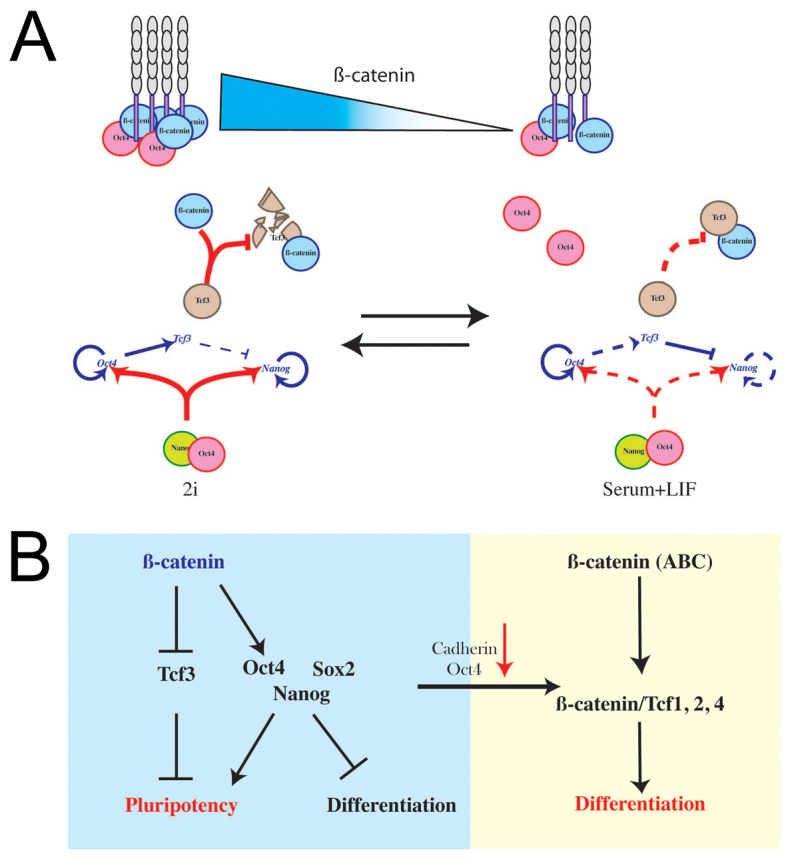
The maintenance of pluripotency in mouse embryonic stem cells (mESCs) relies on the activity of a transcriptional network that is fuelled by the activity of three transcription factors (Nanog, Oct4 and Sox2) and balanced by the repressive activity of Tcf3. Extracellular signals modulate the activity of the network and regulate the differentiation capacity of the cells. Wnt/β-catenin signaling has emerged as a significant potentiator of pluripotency: increases in the levels of β-catenin regulate the activity of Oct4 and Nanog, and enhance pluripotency. A recent report shows that β-catenin achieves some of these effects by modulating the activity of Tcf3, and that this effect does not require its transcriptional activation domain. Here, we show that during self-renewal there is negligible transcriptional activity of β-catenin and that this is due to its tight association with membranes, where we find it in a complex with Oct4 and E-cadherin. Differentiation triggers a burst of Wnt/β-catenin transcriptional activity that coincides with the disassembly of the complex. Our results establish that β-catenin, but not its transcriptional activity, is central to pluripotency acting through a β-catenin/Oct4 complex.


Figures

Fig. 1.
Fig. 1.
Wnt signaling aids pluripotency. (A) Flow cytometry analysis of TNGA (Nanog:GFP) cells after 2 days under the indicated conditions. (B) Representative confocal images of Nanog and Oct4 protein expression in E14Tg2A cells grown in serum+LIF and exposed to the indicated culture conditions for 4 and 24 hours prior to fixation. Scale bar: 50 μm. (C) Real-time qRT-PCR analysis of selected genes in E14Tg2A cells grown in serum+LIF and exposed to 3 μM chiron or Wnt3A-conditioned medium (in N2B27) for 4, 24 or 48 hours, and their controls [DMSO and L-cell-conditioned medium (CM)]. The data shown are normalized to the expression of Gapdh. (D) Effect of knockdown of selected Wnt pathway components on Nanog-GFP expression. (E) Effects of ICRT3 (C3) on TOPFLASH reporter activity (top, left), GFP expression (top, right), and Nanog and Oct4 protein levels (bottom left and right, respectively) in TLG Wnt reporter mESCs grown in serum+LIF.
Fig. 2.
Fig. 2.
β-Catenin is required for pluripotency. (A) Confocal images of β-cateninfl/- and β-catenin-/- cells grown in 2i+LIF stained for Nanog and Oct4 (left), and Tcf3 and Nanog (right). Scale bars: 50 μm (left); and 100 μm (right). (B) Western blot of β-cateninfl/- and β-catenin-/- cells grown in 2i+LIF. Quantification is in supplementary material Fig. S3A. (C) Colony-forming assays for β-cateninfl/- and β-catenin-/- cells under the indicated conditions. Colonies were assayed for alkaline phosphatase (a marker for pluripotency). Quantification of this assay is shown in the graph. (D) TNGA cells grown in serum+LIF and were FACS sorted to isolate cells with low levels of GFP (Low Nanog, LN); colony assays were undertaken in the indicated conditions (basal media was N2B27).
Fig. 3.
Fig. 3.
Wnt reporter activity during self-renewal and differentiation of mESCs. (A) TopFlash assay assessing Wnt/β-catenin transcriptional activity in mESCs (E14Tg2A) under self-renewing (serum+LIF, blue bars) and differentiating conditions (SRA, red bars), or HEK293T cells (green bars). Results are representative of two experiments and the average of three replicates (B,D) Confocal images of Wnt reporter lines grown in serum+LIF and exposed to indicated conditions 24 hours prior to fixation. TK215 (RFP fluorescent, B) and TLG2 (eGFP fluorescence, D) were stained with DAPI to show nuclei (B) or for β-catenin to visualize cell outlines (blue channels, D). (C) Flow cytometry profiles of Wnt reporter lines TK215, TLC2 and TLG2 grown in serum+LIF (blue population) or SRA (red population) for the indicated number of days. (E) Characterization of the Wnt transcriptional inhibitor ICRT3 in TK215 and TLC2 cells. The response of the reporter to the indicated conditions was analyzed by flow cytometry after 72 hours. The increase in fluorescence of cells grown in serum+LIF+C3 is due to an increase in autofluorescence (see supplementary material Fig. S3C).
Fig. 4.
Fig. 4.
The state of β-catenin during self-renewal and differentiation in mESCs. (A) E14Tg2A cells were grown in self-renewing (serum+LIF) or differentiating conditions (SRA) for 4 days. Cell lysates were fractionated with concanavalin A to separate membrane-associated proteins (pellet) from the soluble proteins (soluble). Expression of proteins was assessed by western blot and a quantitative fluorescent system. Analysis of total β-catenin in western blots from whole extracts of mESCs under self-renewal conditions shows two pools: one specific - β-catenin; and a second, slower running, one, which has an unspecified component (Fig. 4A; supplementary material Fig. S4B). Quantification can be found in supplementary material Fig. S4C. (B) E14Tg2A cells grown in serum+LIF were stained for the different isoforms of β-catenin with specific antibodies (see text for details). (C) Mouse ESCs grown and processed as described in A, with the additional treatment consisting of exposure to the indicated conditions 4 hours prior to lysis. Quantifications of western blots are in supplementary material Fig. S6. (D) Confocal images of TLG cells grown in serum+LIF. Twenty-four hours prior to fixation, cells were exposed to L cell-conditioned medium to allow differentiation. Cells were stained for activated β-catenin (ABC) and Nanog. Cells that lack Nanog expression (arrows) elevate expression of the reporter and of ABC, which now can be observed in the nucleus. Scale bar: 50 μm.
Fig. 5.
Fig. 5.
Effects of Wnt/β-catenin signaling on Nanog and Oct4. (A) Representative confocal images of E14Tg2A cells treated for 4 hours with Wnt3A-CM or CM (in N2B27) and stained for total β-catenin (green), Nanog (red) and Oct4 (blue) used for quantitative immunofluorescence (QIF). DAPI was used to identify the nuclei (white). Scale bar: 50 μm. (B-D) Line plot distributions of Nanog (B), Oct4 (C) and total β-catenin (D) obtained by QIF analysis from single sections confocal images as described in A. Fluorescence levels (grayscale) were quantified for each individual cell from four colonies (see Material and methods), binned in 20 classes spaced logarithmically (x-axis); the frequency of each bin is shown on the y-axis. Wnt3A treatment of the cells for 4 hours increases the mean levels of Nanog (mCM=38.68; mWnt=51.35), Oct4 (mCM=81.4; mWnt=135.4) and total β-catenin (mCM=8.41; mWnt=19.34). There is also a decrease in the variability of the levels upon Wnt3A treatment, as reflected by the coefficient of variation of Nanog (CVCM=0.7; CVWnt=0.54), Oct4 (CVCM=0.52; CVWnt=0.43) and total β-catenin (CVCM=0.73; CVWnt=0.57). (E) Scatterplot of the expression of Nanog and Oct4 after 24-hour exposure to Wnt3A-CM relative to serum+LIF. The black line is the linear fitting of the data for the cells in serum+LIF medium (R2: 0.1822); the red line is the linear fitting of the data for Wnt-treated cells (R2: 0.2931), indicating that Wnt signaling increases the correlation between the expression of the proteins across the population (P value=0.017, Fisher r-to-z transformation). (F) Line-plot distribution of Tcf3 QIF analysis in E14Tg2A cells treated with Wnt-CM (red) or CM (pink) for 4 hours. Quantifications were as described in Fig. 4C-E. (G) Scatterplots showing the analysis of Nanog, Oct4 or total β-catenin (x-axis) versus GFP in TLG2 (y-axis) cells grown in serum+LIF. The black lines are the linear fitting of the data (TLG2 versus Nanog R: R2=0.1530; TLG2 versus Oct4: R2=0.1428).
Fig. 6.
Fig. 6.
A β-catenin/Oct4-containing complex is associated with membranes in pluripotent mESCs. (A) E14TgA cells grown in either serum+LIF or 2i for at least two passages prior to lysis and ConA fractionation. (B) Oct4- and β-catenin-containing complexes immunoprecipitated from membrane-associated protein extracts of Tcf3-null (Tcf3-/-) and their wild-type parental (Tcf3+/+) mESC cells were maintained in 2i media for at least two passages prior to lysis. (C) β-cateninfl/-, β-catenin-/- and β-catenin-/- cells rescued with ΔC β-catenin (-/- ΔC) grown in 2i+LIF prior to lysis and ConA fractionation. (D) E14Tg2A and TCF3-null (Tcf3-/-) cells grown in serum+LIF prior to lysis and ConA fractionation. Expression of proteins was assessed by western blot; quantification of blots is shown in supplementary material Figs S8, S9.
Fig. 7.
Fig. 7.
Subcellular localization and function of β-catenin depends on Oct4. (A) Colony assays of Tcf3-null (Tcf3-/-) and their wild-type parental (Tcf3+/+) cells grown in N2B27 or N2B27+XAV939, as indicated. Quantification is shown on the right. (B,C) ZHBTc4 cells grown in serum+LIF with (ZHBTc4-Oct4) or without (ZHBTc4) doxycycline for 24 hours. (B) Cells were stained for total β-catenin (green), Oct4 (red) and Nanog (blue). Scale bar: 50 μm. (C) Colony assays of ZHBTc4 cells with (ZHBTc4-Oct4) or without (ZHBTc4) doxycycline. E14Tg2A and Nanog-null cells grown in serum+LIF in the presence or absence of chiron. Quantification is shown on right. (D) AG23191 cells overexpressing Oct4 from a TetOFF system were grown in serum+LIF in the presence of absence of chiron. Colonies were assayed for alkaline phosphatase activity and quantification of the assay is shown in supplementary material Fig S10.
Fig. 8.
Fig. 8.
A mechanism for β-catenin-mediated regulation of pluripotency. (A) The level of β-catenin is a major determinant of pluripotency through its role in the assembly of a complex with Oct4 and E-cadherin. In the ground state (enriched in 2i conditions), a membrane-associated complex between Oct4 (pink), β-catenin (blue) and cadherin limits the amount of Oct4 available for interactions with other proteins. Most of the Oct4 is available for interactions with Nanog (green), which is abundant in the ground state; the complex promotes pluripotency. In parallel, a different pool of β-catenin interacts with and inactivates Tcf3 (orange), thus allowing efficient activity of the Oct4:Nanog-driven network. If the levels of β-catenin drop, the amount of Oct4 in the membrane-associated complex is reduced and there is more Oct4 available for interactions with other factors, some of which promote lineage priming. The reduced amount of β-catenin limits its interaction with Tcf3, which is now available to repress pluripotency genes. In this state, as a consequence of looser regulation of Oct4 and Tcf3, cells have a higher probability of differentiating and exhibit a noisier pluripotency network. Red lines indicate protein-protein interactions; blue lines indicate transcriptional regulatory interactions. (B) The interactions and activity of β-catenin in these protein complexes does not involve or require its transcriptional activity (for details see text).

References

    1. Aberle H., Bauer A., Stappert J., Kispert A., Kemler R. (1997). beta-catenin is a target for the ubiquitin-proteasome pathway. EMBO J. 16, 3797–3804 - PMC - PubMed
    1. Abu-Remaileh M., Gerson A., Farago M., Nathan G., Alkalay I., Zins Rousso S., Gur M., Fainsod A., Bergman Y. (2010). Oct-3/4 regulates stem cell identity and cell fate decisions by modulating Wnt/β-catenin signalling. EMBO J. 29, 3236–3248 - PMC - PubMed
    1. Aiba K., Sharov A. A., Carter M. G., Foroni C., Vescovi A. L., Ko M. S. (2006). Defining a developmental path to neural fate by global expression profiling of mouse embryonic stem cells and adult neural stem/progenitor cells. Stem Cells 24, 889–895 - PubMed
    1. Angers S., Moon R. T. (2009). Proximal events in Wnt signal transduction. Nat. Rev. Mol. Cell Biol. 10, 468–477 - PubMed
    1. Anton R., Kestler H. A., Kühl M. (2007). Beta-catenin signaling contributes to stemness and regulates early differentiation in murine embryonic stem cells. FEBS Lett. 581, 5247–5254 - PubMed

Publication types

MeSH terms