. 2013;35(2-3):155-71.
doi: 10.1159/000346156. Epub 2013 Feb 22.

Neonatal systemic exposure to lipopolysaccharide enhances susceptibility of nigrostriatal dopaminergic neurons to rotenone neurotoxicity in later life

Affiliations

Neonatal systemic exposure to lipopolysaccharide enhances susceptibility of nigrostriatal dopaminergic neurons to rotenone neurotoxicity in later life

Zhengwei Cai et al. Dev Neurosci. 2013.

Abstract

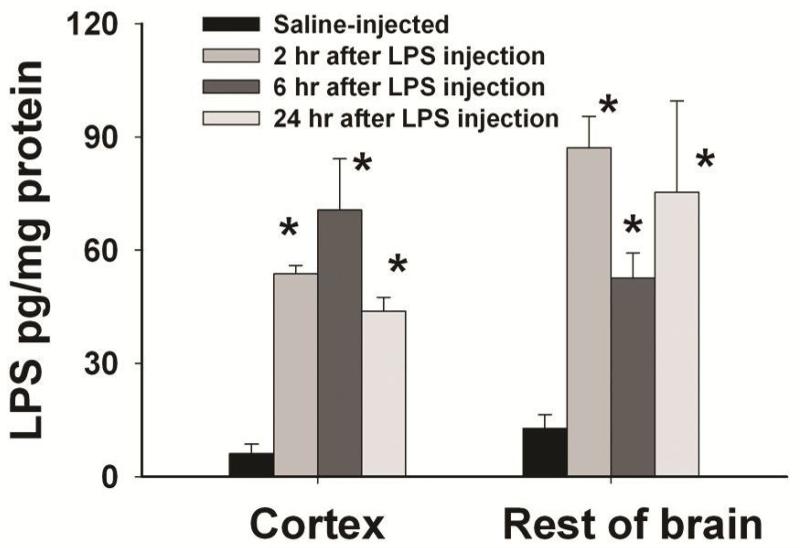
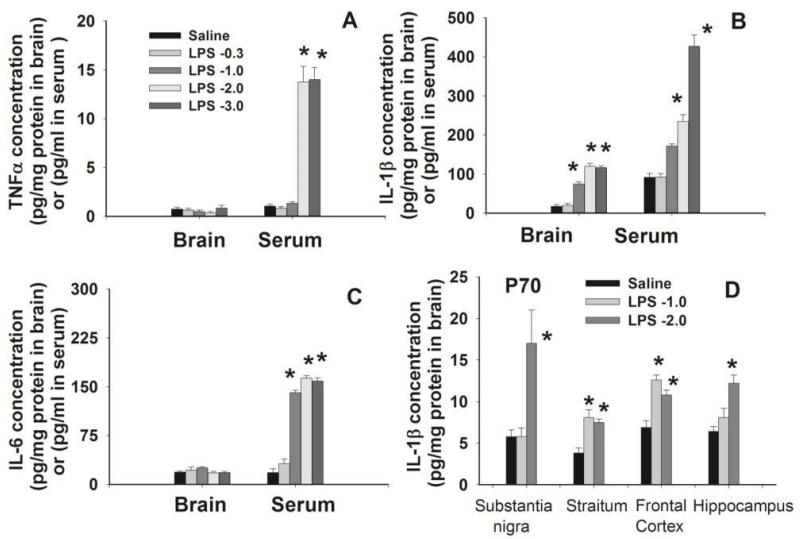
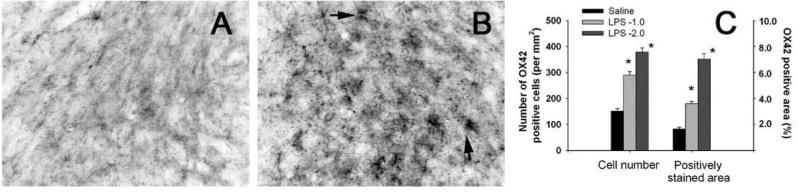
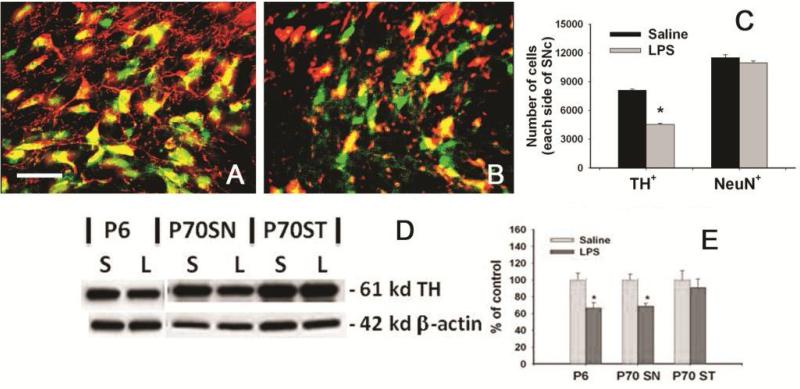
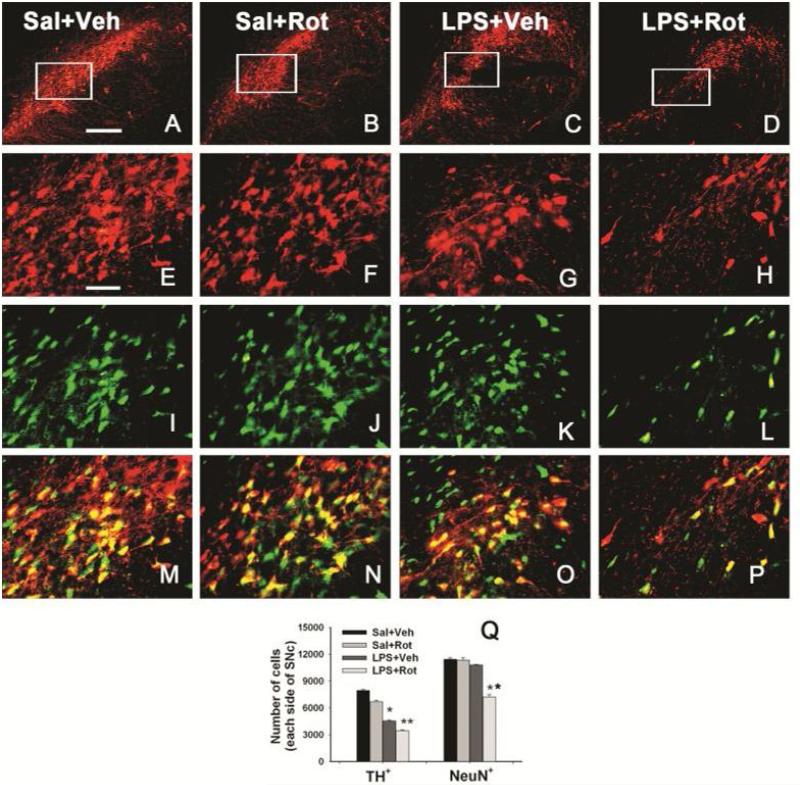
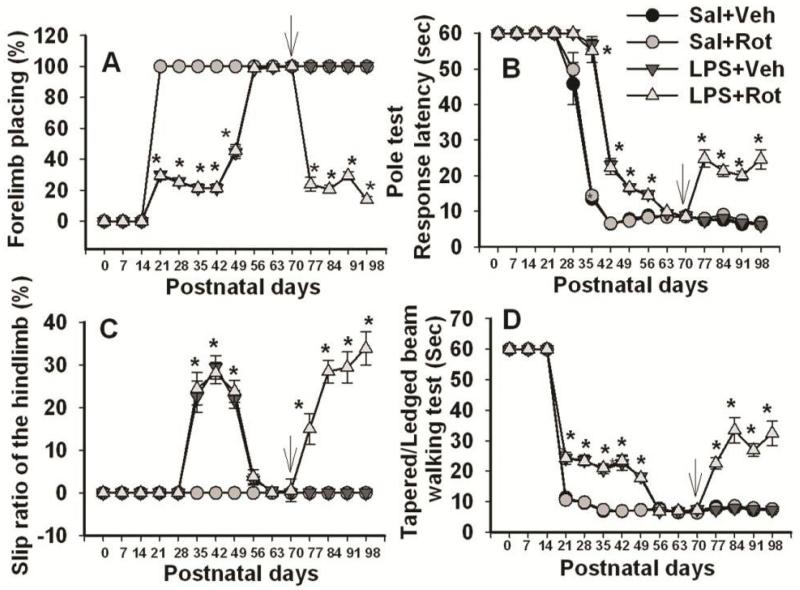
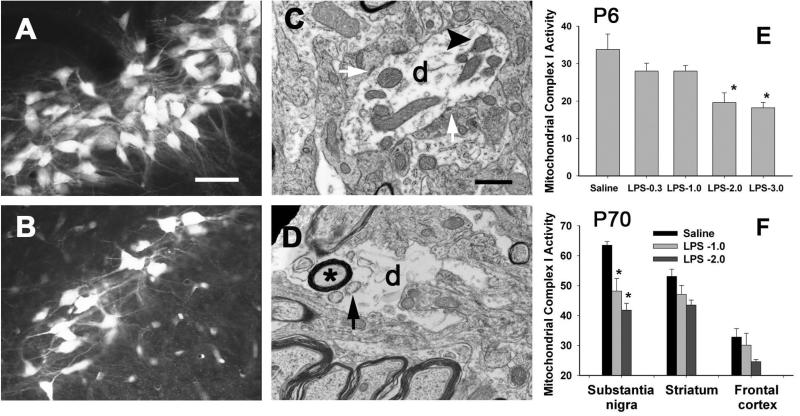
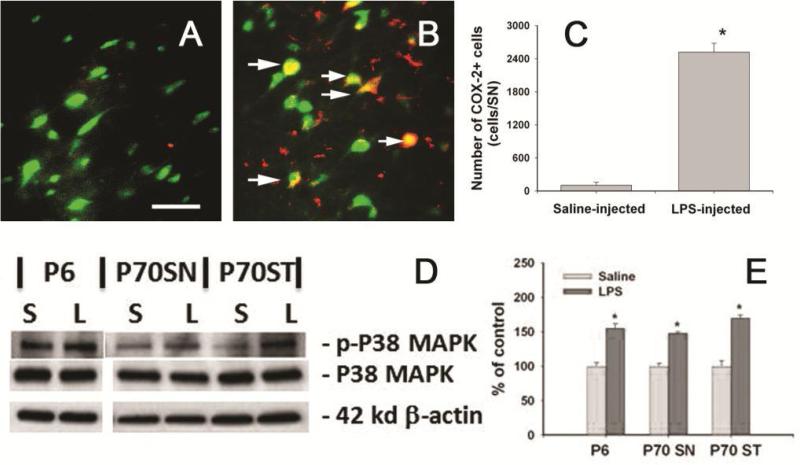
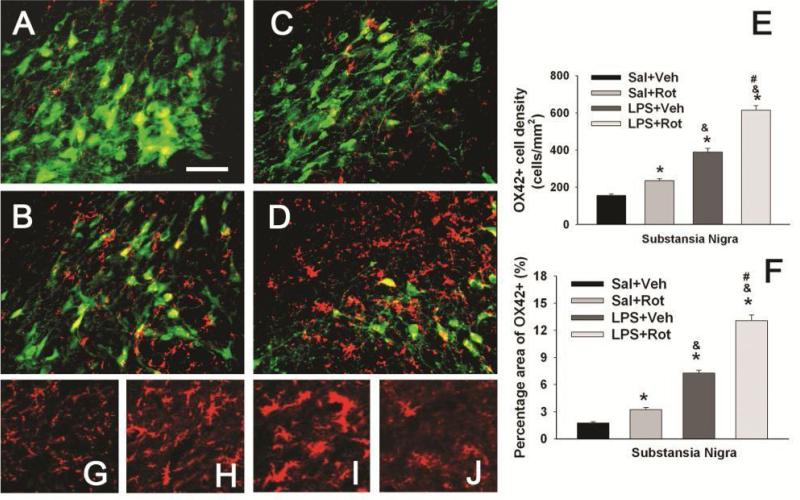
Brain inflammation via intracerebral injection with lipopolysaccharide (LPS) in early life has been shown to increase risks for the development of neurodegenerative disorders in adult rats. To determine if neonatal systemic LPS exposure has the same effects on enhancement of adult dopaminergic neuron susceptibility to rotenone neurotoxicity as centrally injected LPS does, LPS (2 μg/g body weight) was administered intraperitoneally into postnatal day 5 (P5) rats and when grown to P70, rats were challenged with rotenone, a commonly used pesticide, through subcutaneous minipump infusion at a dose of 1.25 mg/kg/day for 14 days. Systemically administered LPS can penetrate into the neonatal rat brain and cause acute and chronic brain inflammation, as evidenced by persistent increases in IL-1β levels, cyclooxygenase-2 expression and microglial activation in the substantia nigra (SN) of P70 rats. Neonatal LPS exposure resulted in suppression of tyrosine hydroxylase (TH) expression, but not actual death of dopaminergic neurons in the SN, as indicated by the reduced number of TH+ cells and unchanged total number of neurons (NeuN+) in the SN. Neonatal LPS exposure also caused motor function deficits, which were spontaneously recoverable by P70. A small dose of rotenone at P70 induced loss of dopaminergic neurons, as indicated by reduced numbers of both TH+ and NeuN+ cells in the SN, and Parkinson's disease (PD)-like motor impairment in P98 rats that had experienced neonatal LPS exposure, but not in those without the LPS exposure. These results indicate that although neonatal systemic LPS exposure may not necessarily lead to death of dopaminergic neurons in the SN, such an exposure could cause persistent functional alterations in the dopaminergic system and indirectly predispose the nigrostriatal system in the adult brain to be damaged by environmental toxins at an ordinarily nontoxic or subtoxic dose and develop PD-like pathological features and motor dysfunction.


Figures

Figure 1
Figure 1
Concentrations of LPS in the rat brain after systemic administration of LPS in P5 rats. LPS (from Escherichia coli, serotype 055: B5) was intraperitoneally injected to P5 rats at a dose of 2 μg/g of body weight and the control rats were injected with the same volume of sterile saline. Concentrations of LPS in the rat brain were determined with an ELISA kit at designated time points. The results are expressed as the mean±SEM of 4 animals in each group, and analyzed by one-way ANOVA. *P<0.05 different from the saline-injected group.
Figure 2
Figure 2
Concentrations of inflammatory cytokines in the rat brain and serum 24 hr (A, B, and C) or 65 days (P70, D) after the i.p. injection with LPS at different doses in P5 rats. The control rats were injected with the same volume of sterile saline. Inflammatory cytokines were determined by ELISA kits. Twenty four hr after LPS administration at a dose of 2 or 3 μg/g body weight, serum levels of TNFα (A), IL-1β (B) and IL-6 (C) were still elevated as compared with the saline-injected group. Regardless of LPS doses, concentrations of TNFα (A) and IL-6 (C) in the rat brain were not different from that in the control rat brain 24 hr after LPS injection, but IL-1β (B) concentration in the LPS-exposed rat brain remained increased as compare with that in the control rat brain. Sixty-five days (P70) after i.p. injection with LPS at 1 or 2 μg/g body weight, concentrations of IL-1β in a variety of brain regions remained significantly higher than that in the control rat brain (D). The results are expressed as the mean±SEM of 4 animals in each group, and analyzed by one-way ANOVA. *P<0.05 different from the saline-injected group.
Figure 3
Figure 3
Sustained microglial activation in the P70 rat brain after the i.p. injection of LPS on P5. Representative images of microglial immunostaining (OX42+) in the SN of P70 control or LPS-exposed rats are shown in A and B, respectively. Most microglia in the P70 control rat brain were weakly stained and at a resting status with a small rod shaped soma and fine, ramified processes, while many OX42+ cells in the SN of LPS (1 or 2 μg/g body weight)-exposed P70 rat brain had bright staining of an enlarged cell body(arrows indicated) with blunt processes (B). Semi-quantification in terms of either OX42+ cell density or OX42+ stained area showed that microglia activation was persistently increased in the LPS-exposed rat brain (C). The results in C are expressed as the mean±SEM of 5 animals in each group, and analyzed by one-way ANOVA. *P<0.05 different from the saline-injected group.
Figure 4
Figure 4
Suppression of TH expression in neurons from the SN of P70 rats with neonatal LPS exposure. Representative merged photomicrographs of TH+ (red) and NeuN+ (green) cells in the SN of the rat brain from the control group and the LPS-exposed group are shown in A and B, respectively. Stereological cell counting showed that neonatal LPS exposure reduced number of TH+ cells, but not NeuN+ cells in the SN of P70 rats (C), suggesting that neonatal LPS exposure suppressed TH expression, but did not cause significant neuronal death in the SN of P70 rat brain. Western blots for TH expression in the whole brain of P6 rats or in the SN or ST of P70 rats (D) and quantification of the blotting data (E) are consistent with immunohistochemistry results. The results in C and E are expressed as the mean±SEM of 5 animals in each group, and analyzed by t-test. *P<0.05 different from the saline-injected group.
Figure 5
Figure 5
Neonatal systemic LPS exposure enhanced rotenone effects on the number of TH+ or NeuN+ cells in the SN of P98 rat brain. Representative photomicrographs of TH+ cells (red) at low magnification (A-D) or high magnification (E-H), NeuN+ cells (green, I-L), and the merged images (M-P) in the SN of rat brain are shown here. Representative images for the saline+vehicle group are shown in A, E, I and M; those for the saline+rotenone group in B, F, J and N; those for the LPS+vehicle group in C, G, K and O; and those for the LPS+rotenone groups in D, H, L and P. Neonatal LPS alone reduced the number of TH positive cells (G) in the SN of P98 rat brain, but did not alter the number of NeuN positive cells (K) in the same area. Rotenone treatment in adult life also slightly decreased the number of TH positive cells (F), but not the number of NeuN positive cells (J) in the saline+roptenone rat brain. Rotenone treatment resulted in not only a further decreased number of TH positive cells (H), but also a significant loss of NeuN positive cells (L), indicating actual death of dopaminergic neurons in the SN. The scale bar shown in A (for A-D) represents 200 μm and that in E (for all other images) 50 μm. Stereologic cell counting data of the number of TH+ cells and the number of NeuN+ cells in the SN area are shown in Q. The results are expressed as the mean±SEM of five animals in each group, and analyzed by one-way ANOVA. *P<0.05 different from the Sal+Veh group; ** P<0.05 different from for the LPS+Veh group.
Figure 6
Figure 6
Neurobehavioral tests in rats following neonatal systemic LPS exposure and rotenone infusion in adult life. A, the vibrissa-elicited forelimb-placing test. B, the pole test. C, slip step ratio and D, performance latency in the tapered/ledged beam walking test. Neonatal LPS exposure resulted in motor dysfunction detectable in all the behavioral tests, but the motor deficits in LPS-exposed rats were recovered by P56-P70. Following rotenone challenge (indicated by an arrow in each panel), impaired motor performances were observed only in rats that had been exposed to LPS on P5, but not in other groups. The results are expressed as the mean±SEM of twelve animals in each group, and analyzed by two-way repeated measures ANOVA. *P<0.05 different from all other groups on the same postnatal day.
Figure 7
Figure 7
Neontal systemic LPS exposure resulted in long-lasting damage to dopaminergic neuronal connectivity determined by FG retrograde labeling in the rat brain and to mitochondrial function. FG retrogradely labeled nigro-striatal dopaminergic neurons in control rats were rather bright and containing extensive smooth dendritic processes (A). In contrast, number of FG labeled dopaminergic neurons in LPS-exposed animals tended to be less and fragmented dendritic processes were observed (B). Ultrastructural characteristics of neuroprofiles in the SN of P70 control and LPS-exposed rat brain are shown in C and D, respectively. Dendrites (labeled with letter d in C and D) with internal structures such as mitochondria (as indicated by an arrow head in C) and synaptic contacts (pointed by white arrows in C) were noted in saline-treated control animals (C). Dendrites in the LPS-exposed rats often had sparse internal contents and contained many vacuoles (arrow indicated in D) and even myelinated axon inclusions (marked with a ‘*’), and were lack of mitochondria and lost synaptic contacts. Neonatal LPS exposure significantly reduced mitochondrial complex I activity (nmol NADH-Ubiquinone Oxidoreductase /min /mg protein) in the P6 rat brain (E) and the SN of P70 rat brain (F). Scale bar in A (for A and B) represents 50 μm, and in C (for C and D) represents 500 nm. The results in E and F are expressed as the mean±SEM of five animals in each group, and analyzed by one-way ANOVA. * P<0.05 different from the saline group.
Figure 8
Figure 8
Neonatal LPS exposed persistently increased COX-2 expression and phosphorylation of P38 MAPK in the P70 rat brain. Representative photomicrographs of COX-2+ (red) and NeuN+ (Green) cells in the SN of P70 control rat brain and LPS-exposed rat brain are shown in A and B. Increased COX-2+ cells were observed in the SN of LPS-exposed rat brain, while almost no COX-2+ cells were found in the control rat brain (A). Many COX-2+ cells found in the LPS-exposed rat brain were NeuN+ neurons (arrows indicated in B). Stereological cell counting data of COX-2+ cells are shown in C. Western blot analysis (D) showed that neonatal LPS significantly increased P38 phosphorylation in the P6 rat brain and the SN and ST of P70 rat brain. Semi-quantification of the blotting data is shown in E. The results in C and E are expressed as the mean±SEM of five animals in each group, and analyzed by t-test. * P<0.05 different from the saline group
Figure 9
Figure 9
Neonatal LPS exposure enhanced microglia activation triggered by a small dose of rotenone in the P98 rat brain. Representative photomicrographs of OX42 (red) and NeuN (green) immunostaining in the SN are shown for the saline+vehicle group (A); the LPS+vehicle group (B); the saline+rotenone group (C); and the LPS+rotenone group (D). The quantitative data of microglia activation are presented as the density of OX42 positive cells in the SN (E) or the percentage area that contains OX42 positive staining in the images (F). Microglia at a resting status with a small rod shaped soma and ramified processes (G) were detected in the SN of the saline+vehicle group (A). Neonatal LPS exposure resulted in chronic activation of microglia in the SN of the LPS+vehicle group, as indicated by the increased density of OX42+ cells (E) or increased percentage area containing OX42 staining (F) and the altered cell morphology (elongated cell body with blunt processes, as shown in H). Rotenone treatment at adult life also activated microglia in the SN of the saline+rotenone group (C), as indicated by the increased density of OX42+ cells (E) and OX42+ stained area (F). But morphology of OX42+ cells in this group remained similar to those in LPS+vehicle group. Activation of microglia triggered by this dose of rotenone was enhanced in LPS+rotenone group (D), as indicated by the further increased density of OX42+ cells (E) or further increased percentage area containing OX42 staining (F) as compared to that in the LPS+vehicle group. The soma of OX42+ cells in this group was further enlarged and many of them lost processes (I) or even became round-shaped (J). The scale bar in A represents 50 μm. The results in E and F are expressed as the mean±SEM of five animals in each group, and analyzed by one-way ANOVA. * P<0.05 different from the Sal+Veh group; & P<0.05 different from the Sal+Rot group; and # P<0.05 different from the LPS+Veh group.

References

    1. Hagberg H, Gressens P, Mallard C. Inflammation during fetal and neonatal life: implications for neurologic and neuropsychiatric disease in children and adults. Ann Neurol. 2012;71:444–457. - PubMed
    1. Meyer U, Yee BK, Feldon J. The neurodevelopmental impact of prenatal infections at different times of pregnancy: the earlier the worse? Neuroscientist. 2007;13:241–256. - PubMed
    1. Meyer U, Feldon J, Fatemi SH. In-vivo rodent models for the experimental investigation of prenatal immune activation effects in neurodevelopmental brain disorders. Neurosci Biobehav Rev. 2009;33:1061–1079. - PubMed
    1. Patterson PH. Neuroscience. Maternal effects on Schizophrenia risk. Science. 2007;318:576–577. - PubMed
    1. Ghiani CA, Mattan NS, Nobuta H, Malvar JS, Boles J, Ross MG, Waschek JA, Carpenter EM, Fisher RS, de Vellis J. Early effects of lipopolysaccharide-induced inflammation on foetal brain development in rats. ASN Neuro. 2011 Nov 17;3(4):e00068. Pii. doi: 10.1042/AN20110027. - PMC - PubMed

Publication types

MeSH terms