Review
. 2013 Feb 27;13(1):36-52.
doi: 10.1102/1470-7330.2013.0005.

PET/MR: a paradigm shift

Affiliations
Review

PET/MR: a paradigm shift

Florian C Gaertner et al. Cancer Imaging. .

Abstract

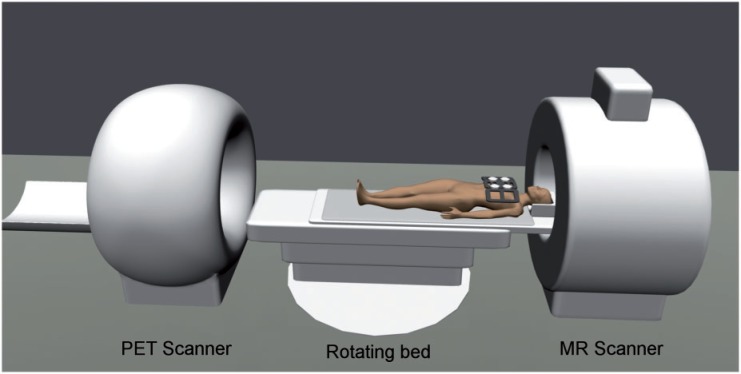
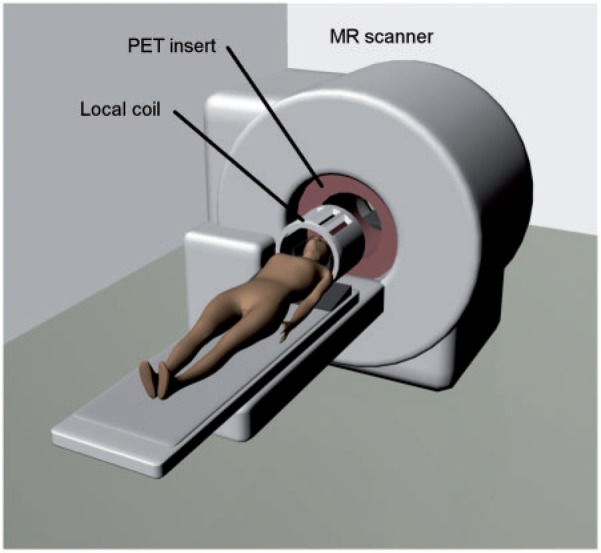
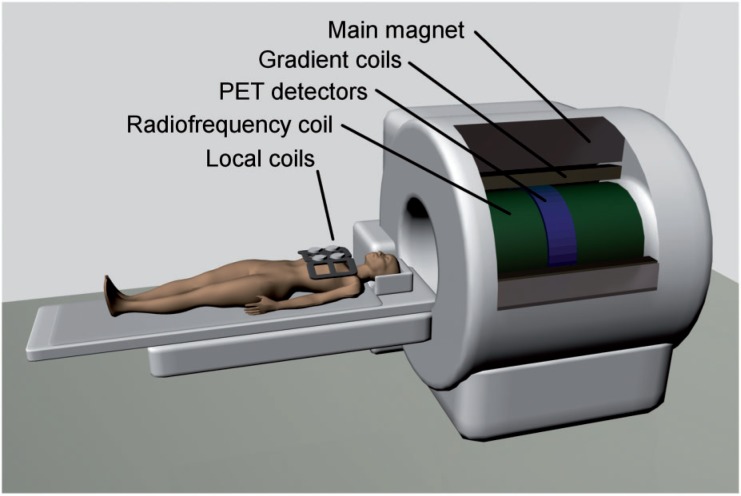
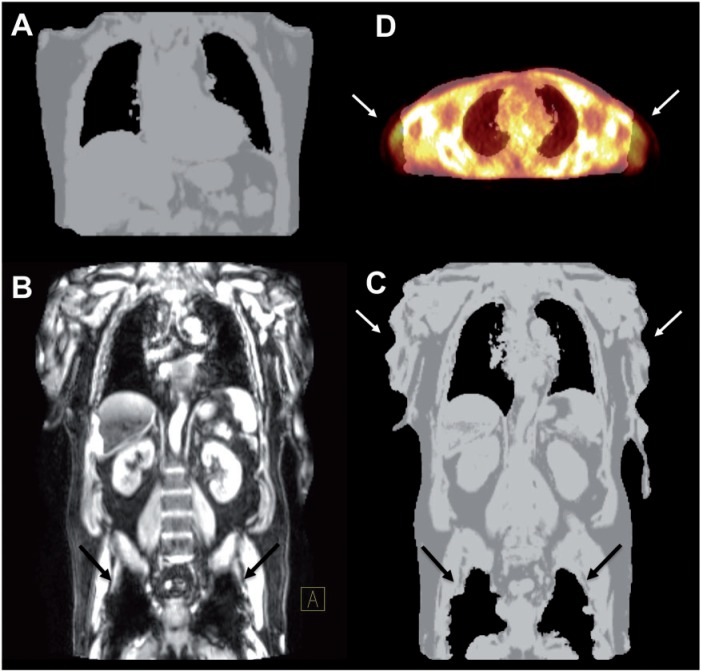
More than a decade ago, multimodality imaging was introduced into clinical routine with the development of the positron emission tomography (PET)/computed tomography (CT) technique. Since then, PET/CT has been widely accepted in clinical imaging and has emerged as one of the main cancer imaging modalities. With the recent development of combined PET/magnetic resonance (MR) systems for clinical use, a promising new hybrid imaging modality is now becoming increasingly available. The combination of functional information delivered by PET with the morphologic and functional imaging of MR imaging (e.g., diffusion-weighted imaging, dynamic contrast-enhanced MR imaging and MR spectroscopy) offers exciting possibilities for clinical applications as well as basic research. However, the differences between CT and MR imaging are fundamental. This also leads to distinct differences between PET/CT and PET/MR not only regarding image interpretation but also concerning data acquisition, data processing and image reconstruction. This article provides an overview of the principal differences between PET/CT and PET/MR in terms of scanner design and technology, attenuation correction, speed, acquisition protocols, radiation exposure and safety aspects. PET/MR is expected to show advantages over PET/CT in clinical applications in which MR is known to be superior to CT due to its high intrinsic soft tissue contrast. However, as of now, only assumptions can be made about the future clinical role of PET/MR, as data about the performance of PET/MR in the clinical setting are still limited. The possible future clinical use of PET/MR in oncology, neurology and neurooncology, cardiology and imaging of inflammation is discussed.


Figures

Figure 1
Figure 1
The tandem design is the most straightforward system design for PET/MR scanners. In principle it is the same strategy used in PET/CT scanners, with the 2 modalities physically separated from each other, connected by a common patient bed, on which the patient is moved from one modality to the other sequentially. This approach is advantageous as, aside from shielding, only small technical adjustments are needed regarding the PET and MR devices. However, this approach does not allow simultaneous acquisition of PET and MR data. Moreover, sequential scanning leads to longer examination times for the patient, and one subsystem is always idle. Image is courtesy of Gaspar Delso.
Figure 2
Figure 2
The insert architecture consists of an MR-compatible PET detector ring, which is introduced into an existing MR scanner, allowing truly simultaneous acquisition of PET and MR data. This approach demands a complete redesign of the PET detector technology, as the conventionally used PMTs cease to work in the high magnetic field strengths of the MR scanner. As only minimal changes to preexisting MR devices are needed, this approach would constitute a cost-effective way for institutions to gain access to PET/MR imaging. However, the PET insert substantially narrows the MR gantry, which limits this approach to preclinical imaging and to imaging of the head and extremities in patients. Image is courtesy of Gaspar Delso.
Figure 3
Figure 3
Fully integrated PET/MR designs for clinical whole-body imaging have recently become commercially available. These scanners allow truly simultaneous acquisition of PET and MR data in patients, which reduces the examination time in comparison with sequential approaches, and opens up new possibilities for clinical research. This approach is most challenging from the technological point of view, as it demands a complete redesign of the PET detector ring, as well as substantial changes to the MR technology. PMTs have been replaced by APDs, which allow detection of the scintillation light even in high magnetic field strengths, and the PET detector ring has been integrated between the RF and gradient coils of the MR gantry. Image is courtesy of Gaspar Delso.
Figure 4
Figure 4
(A) Attenuation map of one PET bed position generated from the 2-point MR Dixon sequence using segmentation algorithms as implemented on the Biograph mMR without obvious artifacts. (B) Metal, such as in hip implants, does not yield an MR signal and reduces the signal in its vicinity (arrows). (C) The resulting attenuation map as generated by the Biograph mMR therefore wrongly exhibits air instead (black arrows). Furthermore, truncation artifacts may occur at the edge of the transverse field of view of the MR (white arrows). (D) A transaxial slice of the fusion of an attenuation map with the emission image clearly shows the truncation of arms in the attenuation map due to the smaller field of view of the MR (arrows).
Figure 5
Figure 5
Sample workflows for oncologic diagnostic PET/MR protocols. First, MR localizers are performed for planning of PET bed positions. Then, PET emission data are acquired. Here, the body trunk can be covered by about 4 bed positions (e.g., 4 min emission time per bed position). Simultaneously, a Dixon sequence for attenuation correction and additional diagnostic MR sequences are run at each bed position, e.g., a coronal T1 turbo spin echo (TSE) and an axial T2 half Fourier acquisition single shot turbo spin echo (HASTE) with fat suppression. However, as the application of MR contrast agent may affect the generation of the attenuation correction map, Gd should not be administered before all MR Dixon sequences are completed. Optional diagnostic MR sequences are then performed over the region of special interest depending on the clinical indication. Contrast agents can be injected if necessary. During this phase, additional PET data may be collected at the corresponding bed position using long emission times, delivering potentially lower-noise PET images. Concluding MR scans may be acquired covering the body trunk (thorax, abdomen, pelvis) after the application of Gd, e.g., axial T1 volumetric interpolated breath-hold examination (VIBE) sequences. (A) Sample workflow with focus on the liver using e.g., [18F]FDG or 68Ga-labeled somatostatin analogues for staging of patients with neuroendocrine tumors. (B) Sample workflow with focus on the neck for staging of patients with head and neck cancer. (C) Sample workflow for imaging of patients with prostate cancer using choline PET/MR. Image is adapted from Ref.[55].
Figure 6
Figure 6
A 58-year-old man with biopsy proven synovial sarcoma of the left thigh. The patient was restaged by PET/MR after neoadjuvant radiotherapy. (A–C) Remaining pathologically increased glucose metabolism (maximum standardized uptake value 7.2) is observed especially in the solid medial tumor part (A, PET; B, PET/MR fusion), which also shows increased contrast enhancement in the fat-suppressed T1-weighted image after the application of Gd (C), consistent with remaining vital tumor tissue after radiotherapy. (D) High-resolution anatomic MR imaging (T2-weighted image) delivers valuable information for planned tumor resection, e.g., the close proximity of the tumor to the femoral vessels and nerve (arrows).
Figure 7
Figure 7
A 69-year-old patient with suspected prostate cancer (prostate-specific antigen 12 ng/ml). (A) [11C]Choline PET/MR shows pathologically increased tracer uptake in the left peripheral zone of the prostate, suspicious of the primary tumor (arrow). (B–D) Consistent with choline PET, the T2-weighted MR images show a suspicious signal loss in the left peripheral zone (B, arrow), corresponding to an area of increased perfusion in the DCE MR sequence (C, arrow) and a low apparent diffusion coefficient in the diffusion-weighted MR images (D, arrow). Subsequent prostatectomy confirmed a carcinoma of the prostate in the left peripheral zone.
Figure 8
Figure 8
A 73-year-old patient with a neuroendocrine carcinoma of the small intestine and metastatic spread to the liver. 68Ga-DOTATOC PET/MR shows increased uptake in 2 of the hepatic lesions, corresponding to overexpression of the somatostatin receptor (black arrows; A, PET; B, PET/MR fusion). (C) Diffusion-weighted MRI shows a third suspicious hepatic lesion that was not detected by PET, possibly due to loss of receptor expression (white open arrow). (D) A low apparent diffusion coefficient of this lesion, however, indicates that it indeed is a metastasis (white open arrow).
Figure 9
Figure 9
FDG-PET/MR in a patient with cognitive impairment and suspicion of a neurodegenerative disease. Cortical glucose hypometabolism is observed in the parietal and temporal lobes bilaterally, more pronounced in the left hemisphere (D), overall consistent with Alzheimer disease. Transaxial PET images (A) show most pronounced hypometabolism in the left temporal lobe, whereas T1-weighted MR images (B) and PET/MR fusion images (C) indicate that the decreased FDG uptake in the dorsal part of the left temporal lobe is due to cortical atrophy (blue arrow), whereas true glucose hypometabolism is present in the rostral parts of the temporal lobe without signs of cortical atrophy (red arrow). Image is courtesy of Alexander Drzezga.
Figure 10
Figure 10
A 57-year-old man with cardiac 3-vessel disease and reduced left-ventricular function (ejection fraction 40%). PET/MR was performed two months after anterior infarction and stenting of left anterior descending artery and first ramus posterolateralis to delineate myocardial viability. Late gadolinium enhancement (LGE) images revealed a nontransmural uptake pattern in the apex and the inferolateral wall with matching, modestly reduced, FDG uptake (filled arrows). However, note the nontransmural late gadolinium enhancement in the anterior wall (open arrow) with almost normal FDG uptake pointing to the synergetic effects of PET and MRI. Image is courtesy of Stephan G. Nekolla.

References

    1. Beyer T, Townsend DW, Brun T, et al. A combined PET/CT scanner for clinical oncology. J Nucl Med. 2000;41:1369–1379. PMid:10945530. - PubMed
    1. Czernin J, Allen-Auerbach M, Schelbert HR. Improvements in cancer staging with PET/CT: literature-based evidence as of September 2006. J Nucl Med. 2007;48(Suppl 1):78S–88S. PMid:17204723. - PubMed
    1. Wechalekar K, Sharma B, Cook G. PET/CT in oncology–a major advance. Clin Radiol. 2005;60:1143–1155. doi: 10.1016/j.crad.2005.05.018. . PMid:16223611. - DOI - PubMed
    1. Picchio M, Mansueto M, Crivellaro C, et al. PET/CT and contrast enhanced CT in single vs. two separate sessions: a cost analysis study. Q J Nucl Med Mol Imaging. 2012;56:309–316. PMid:22510702. - PubMed
    1. Townsend DW. Combined positron emission tomography-computed tomography: the historical perspective. Semin Ultrasound CT MR. 2008;29:232–235. doi: 10.1053/j.sult.2008.05.006. . PMid:18795489. - DOI - PMC - PubMed

Publication types

MeSH terms