. 2013 Mar 5;80(10):890-6.
doi: 10.1212/WNL.0b013e3182840bbe. Epub 2013 Feb 27.

Brain β-amyloid load approaches a plateau

Affiliations

Brain β-amyloid load approaches a plateau

Clifford R Jack Jr et al. Neurology. .

Abstract

Objective: To model the temporal trajectory of β-amyloid accumulation using serial amyloid PET imaging.

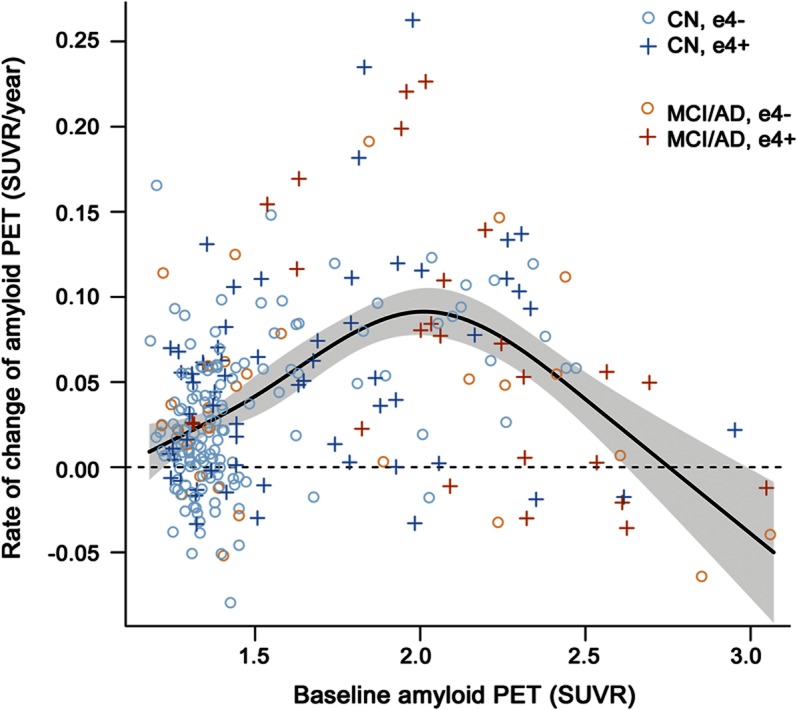
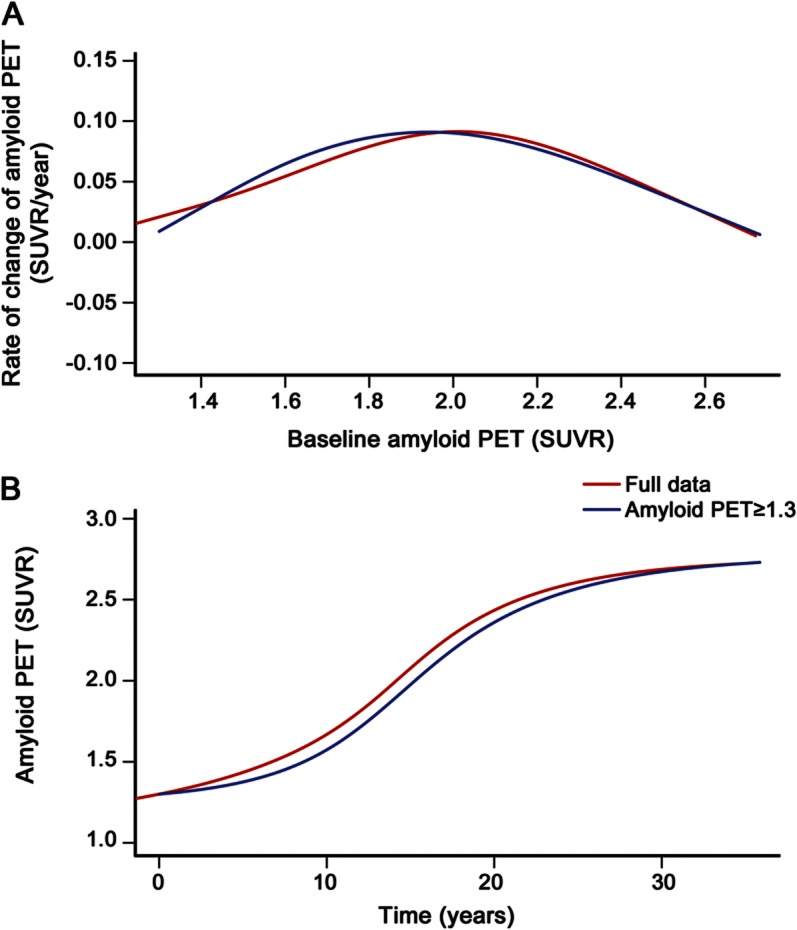
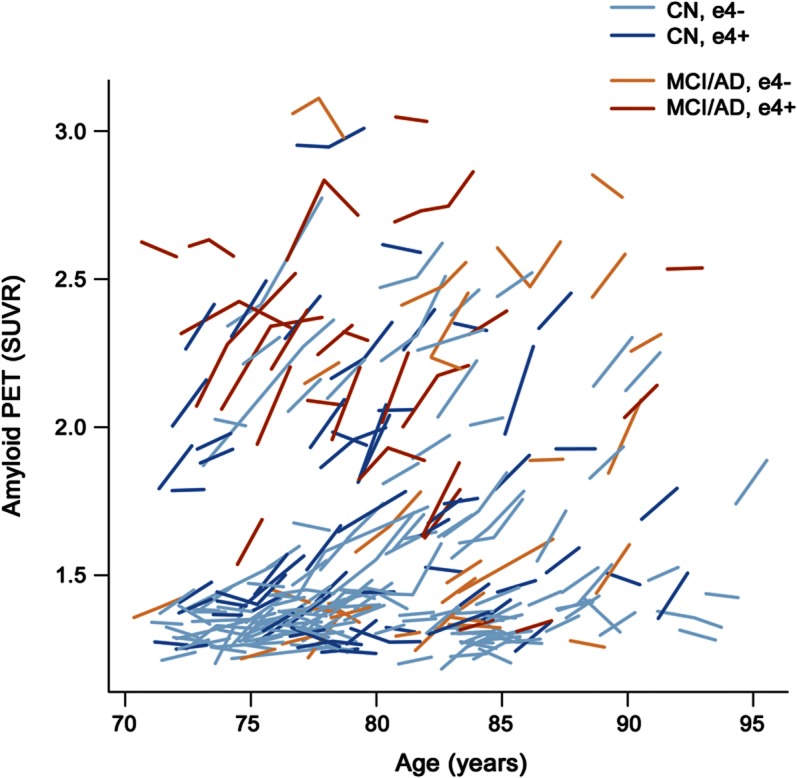
Methods: Participants, aged 70-92 years, were enrolled in either the Mayo Clinic Study of Aging (n = 246) or the Mayo Alzheimer's Disease Research Center (n = 14). All underwent 2 or more serial amyloid PET examinations. There were 205 participants classified as cognitively normal and 55 as cognitively impaired (47 mild cognitive impairment and 8 Alzheimer dementia). We measured baseline amyloid PET-relative standardized uptake values (SUVR) and, for each participant, estimated a slope representing their annual amyloid accumulation rate. We then fit regression models to predict the rate of amyloid accumulation given baseline amyloid SUVR, and evaluated age, sex, clinical group, and APOE as covariates. Finally, we integrated the amyloid accumulation rate vs baseline amyloid PET SUVR association to an amyloid PET SUVR vs time association.

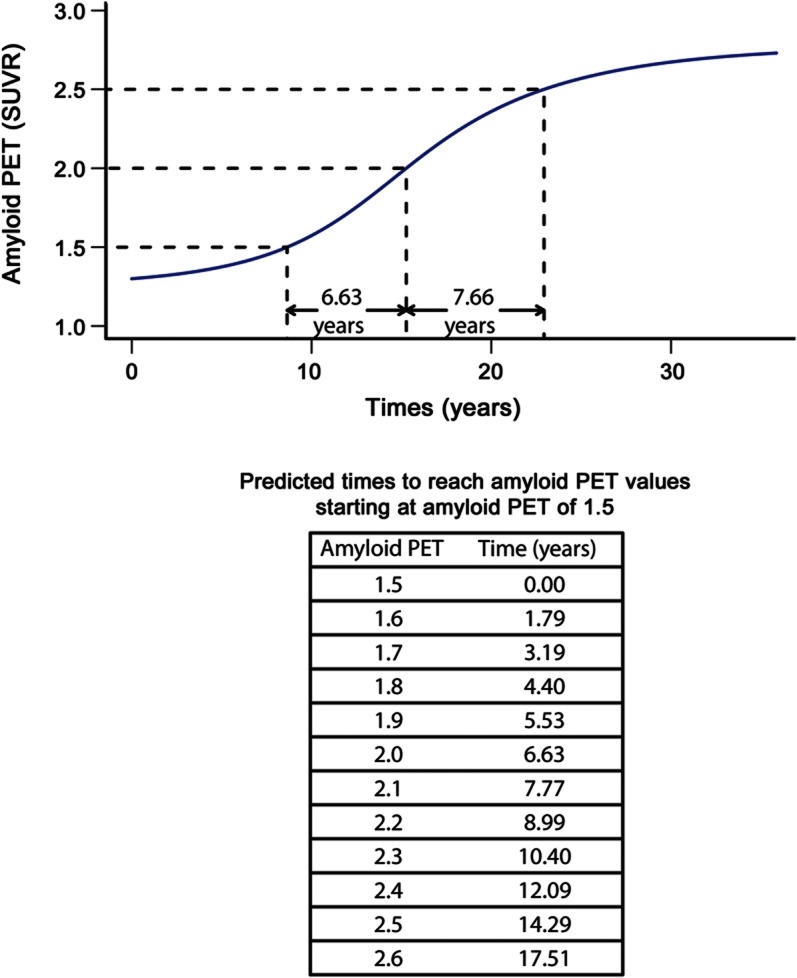
Results: Rates of amyloid accumulation were low at low baseline SUVR. Rates increased to a maximum at baseline SUVR around 2.0, above which rates declined-reaching zero at baseline SUVR above 2.7. The rate of amyloid accumulation as a function of baseline SUVR had an inverted U shape. Integration produced a sigmoid curve relating amyloid PET SUVR to time. The average estimated time required to travel from an SUVR of 1.5-2.5 is approximately 15 years.

Conclusion: This roughly 15-year interval where the slope of the amyloid SUVR vs time curve is greatest and roughly linear represents a large therapeutic window for secondary preventive interventions.


Figures

Figure 1
Figure 1. Rates as a function of baseline amyloid standardized uptake values
Scatterplot of annual rate of change of amyloid PET standardized uptake values (SUVR) vs baseline amyloid PET SUVR for all subjects (n = 260). The estimated mean slope from a linear regression model is shown with 95% confidence limits. Age, sex, diagnosis, and APOE genotype were not significant covariates in the model and are therefore not included here. Cognitively normal (CN) participants who are APOE ε4− are represented by light blue circles, CN participants who are APOE ε4+ are represented by dark blue plus signs, impaired participants who are APOE ε4− are represented by light orange circles, and impaired participants who are APOE ε4+ are represented by dark orange plus signs. AD = Alzheimer disease; MCI = mild cognitive impairment.
Figure 2
Figure 2. Relating the inverted U-shaped amyloid rates as a function of baseline standardized uptake values to sigmoid-shaped trajectory of amyloid accumulation with time
(A) The rate of amyloid accumulation per year as a function of baseline amyloid load in standardized uptake value (SUVR) units. The red plot in A is the same as the plot in figure 1, except for the upper bound truncation (see below). (B) The integral with respect to time of the data in (A) which models amyloid level in SUVR units as a function of increasing time in years. These plots are provided for all participants (n = 260, in red) and for only those participants whose baseline amyloid PET was 1.3 SUVR or greater (n = 212, in blue). For both the lower truncated (at 1.3 SUVR) and nontruncated analyses, the upper SUVR in the model was truncated at 2.7.
Figure 3
Figure 3. Estimates of time required to travel from a baseline amyloid PET load of 1.5 standardized uptake values to greater values
This is illustrated in the plot of amyloid PET load vs time in participants whose baseline standardized uptake value (SUVR) was greater than or equal to 1.3 (n = 212, in blue from figure 2B).
Figure 4
Figure 4. Within-subject trajectories of amyloid PET standardized uptake values by age for all subjects (n = 260)
Cognitively normal (CN) participants are represented by blue lines and impaired participants by orange lines. Lighter colored lines represent APOE ε4− participants and darker colors represent APOE ε4+ participants. AD = Alzheimer disease; MCI = mild cognitive impairment.

Comment in

  • Backwaters and rapids on the amyloid river.
    Burns JM, Swerdlow RH. Burns JM, et al. Neurology. 2013 Mar 5;80(10):878-9. doi: 10.1212/WNL.0b013e3182840d14. Epub 2013 Feb 27. Neurology. 2013. PMID: 23446682 No abstract available.

References

    1. Fagan AM, Head D, Shah AR, et al. Decreased cerebrospinal fluid Abeta(42) correlates with brain atrophy in cognitively normal elderly. Ann Neurol 2009;65:176–183 - PMC - PubMed
    1. Shaw LM, Vanderstichele H, Knapik-Czajka M, et al. Cerebrospinal fluid biomarker signature in Alzheimer's disease neuroimaging initiative subjects. Ann Neurol 2009;65:403–413 - PMC - PubMed
    1. Jagust WJ, Zheng L, Harvey DJ, et al. Neuropathological basis of magnetic resonance images in aging and dementia. Ann Neurol 2008;63:72–80 - PMC - PubMed
    1. Vemuri P, Whitwell JL, Kantarci K, et al. Antemortem MRI based STructural Abnormality iNDex (STAND)-scores correlate with postmortem Braak neurofibrillary tangle stage. Neuroimage 2008;42:559–567 - PMC - PubMed
    1. Klunk WE, Engler H, Nordberg A, et al. Imaging brain amyloid in Alzheimer's disease with Pittsburgh Compound-B. Ann Neurol 2004;55:306–319 - PubMed

Publication types

MeSH terms

Substances