. 2013 May;109(10):2451-65.
doi: 10.1152/jn.01010.2012. Epub 2013 Feb 27.

Animal-to-animal variability in the phasing of the crustacean cardiac motor pattern: an experimental and computational analysis

Affiliations

Animal-to-animal variability in the phasing of the crustacean cardiac motor pattern: an experimental and computational analysis

Alex H Williams et al. J Neurophysiol. 2013 May.

Erratum in

  • J Neurophysiol. 2013 Aug;110(4):1036

Abstract

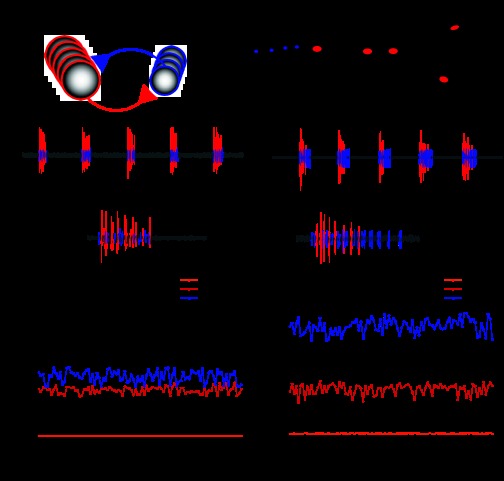
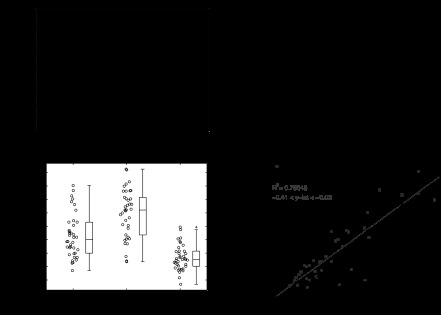
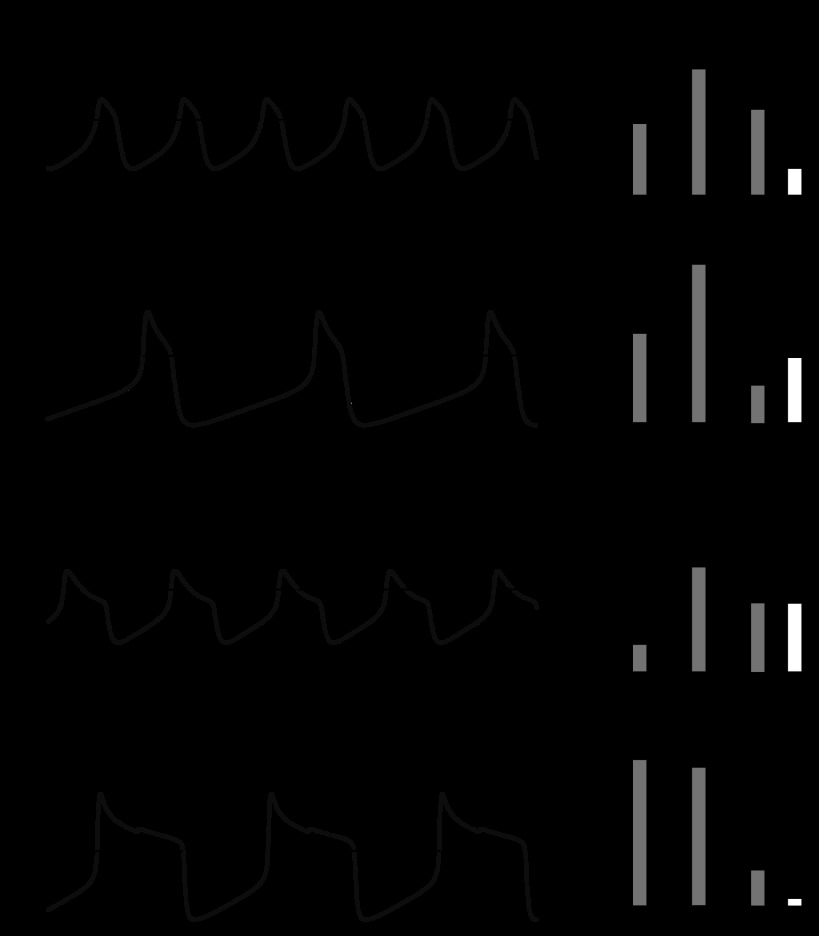
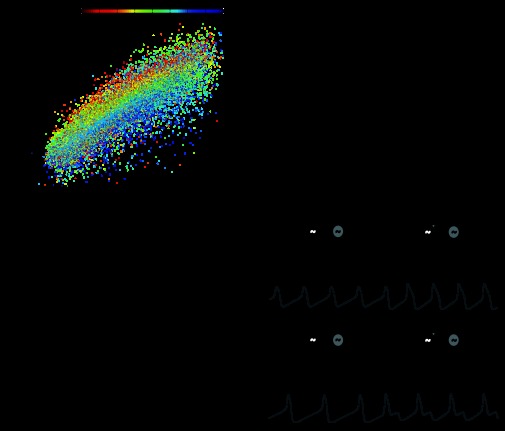
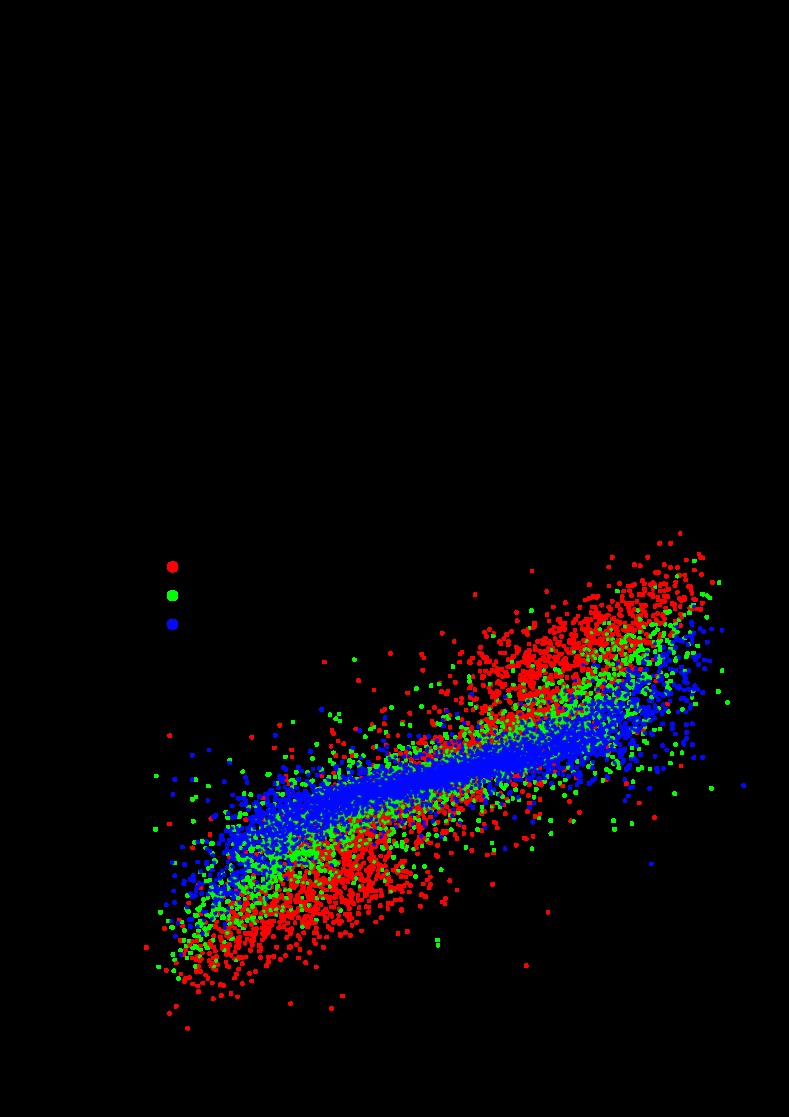
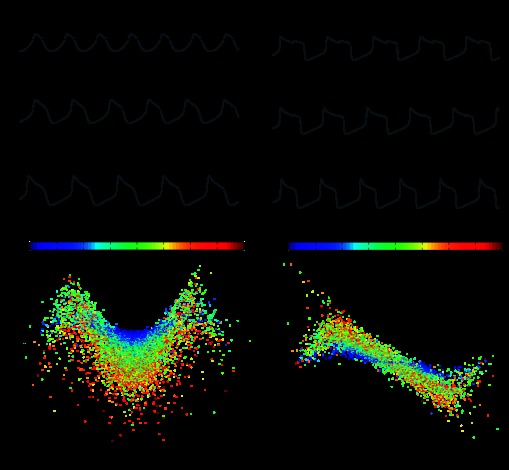
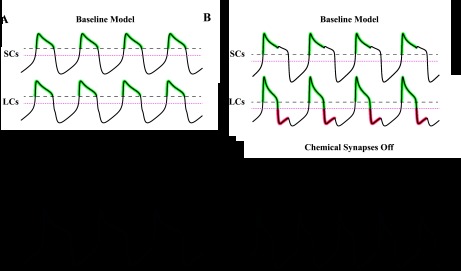
The cardiac ganglion (CG) of Homarus americanus is a central pattern generator that consists of two oscillatory groups of neurons: "small cells" (SCs) and "large cells" (LCs). We have shown that SCs and LCs begin their bursts nearly simultaneously but end their bursts at variable phases. This variability contrasts with many other central pattern generator systems in which phase is well maintained. To determine both the consequences of this variability and how CG phasing is controlled, we modeled the CG as a pair of Morris-Lecar oscillators coupled by electrical and excitatory synapses and constructed a database of 15,000 simulated networks using random parameter sets. These simulations, like our experimental results, displayed variable phase relationships, with the bursts beginning together but ending at variable phases. The model suggests that the variable phasing of the pattern has important implications for the functional role of the excitatory synapses. In networks in which the two oscillators had similar duty cycles, the excitatory coupling functioned to increase cycle frequency. In networks with disparate duty cycles, it functioned to decrease network frequency. Overall, we suggest that the phasing of the CG may vary without compromising appropriate motor output and that this variability may critically determine how the network behaves in response to manipulations.

Keywords: central pattern generator; morris-lecar model; neuronal oscillators; phase relationships.


Figures

Fig. 1.
Fig. 1.
Extracellular recordings of the cardiac ganglion (CG) showing variable phase relationships. A: schematic network diagram of the CG. The network consists of nine neurons: five motor neurons [“large cells” (LCs)] and four interneurons [“small cells” (SCs)]. B: anatomic schematic diagram of the CG showing extracellular recording sites. Blue circles represent SC soma; red circles represent LC soma. Dotted circles represent extracellular recording wells. Our primary recordings were from the site in the middle of the ganglion, the anterior trunk. The additional recording site on the motor nerve was used to ensure that spikes recorded from the anterior trunk were correctly identified. C and D: extracellular recordings from the anterior trunk in two experimental preparations of the CG. SC and LC spikes are colored as blue and red, respectively. Note that LC activity was similar in terms of frequency and burst duration, meaning that cardiac output was likely to be similar in both preparations. In C, LCs and SCs initiate and terminate their bursts nearly simultaneously. In D, LCs and SCs initiate their bursts together but terminate their bursts at different time points. E and F: cycle-to-cycle calculation of phase for 100 cycles of the recordings shown in C and D. Note that the phases of SC and LC burst offset were substantially different between the two preparations as well as more variable over the course of the experiment on a cycle-to-cycle basis. E: cycle-to-cycle calculation of phase for the preparation shown in C. F: cycle-to-cycle calculation of phase for the preparation shown in D.
Fig. 2.
Fig. 2.
Pooled analysis of variability in the phase relationships of the CG motor pattern. A: dot and box plots showing the distribution of the LC start, LC end, and SC end phases in n = 38 preparations. The lines within the box plot denote the median, upper, and lower quartiles, with the whiskers denoting the most extreme data within 1.5 times the interquartile range from the nearest quartile. Outliers beyond these extremes are denoted by the “+” symbol. B: angular deviation for each phase of the CG rhythm. Error bars denote SEs, as estimated by bootstrapping with 10,000 bootstrap samples. LC end and SC end phases were significantly more variable than the LC start phase (P < 0.001, Bonferonni correction for multiple comparisons). C: dot and box plots showing the distribution of LC and SC duty cycles and the duty cycle difference (SC − LC). D: pairwise regressions between SC (gray) and LC (black) burst durations and the cycle period. For each regression, the coefficient of determination and 95% confidence interval for the y-intercept are shonw. Note that neither regression line passed through the origin (y-intercepts were both negative), indicating that burst duration does not proportionally scale with cycle period.
Fig. 3.
Fig. 3.
Example model network voltage traces with accompanying bar plots showing parameter values. The dashed line marks the burst threshold (0 mV) in A–D. All parameters were plotted in units of μS/cm2 to the right of each voltage trace. Scale bars = 30 mV and 500 ms. A and B: two different model networks in which the two cells exhibited nearly identical oscillation patterns, with bursts beginning and ending concurrently. While having similar phasing, these two networks displayed drastically different cycle frequencies. C and D: two model networks in which the two cells initiated their bursts at nearly identical phases but terminated their bursts at different phases. Again, note the large difference in cycle frequency between these two examples, despite having similar phase relationships.
Fig. 4.
Fig. 4.
Pooled phase analysis of the simulated population of model networks (n = 13,141). The burst onset of the oscillator with the larger duty cycle was taken as the starting reference point for phase analysis (analogous to the SC burst start in the biological system). Dot plots and box plots show the distribution of start and end phases for the small duty cycle oscillator (analogous to LCs), the end phase of the large duty cycle oscillator (analogous to the SC end phase), and the phase delay between end phases. The pattern of variability observed within these model networks resembled the experimental data shown in Fig. 2, A and C. The lines within the box plot denote the median, upper, and lower quartiles, with the whiskers denoting the most extreme data within 1.5 times the interquartile range from the nearest quartile. Due to the large number of points, outliers beyond these extremes were not marked.
Fig. 5.
Fig. 5.
The phasing of the model networks is strongly determined by the intrinsic duty cycles of the two oscillators. A: scatterplot of the intrinsic duty cycle versus the network duty cycle for all model oscillators (n = 26,282), showing a strong positive correlation (pairwise linear regression, R2 = 0.78). The color of each point represents the intrinsic duty cycle of the other oscillator within the network (see color bar). B: the difference in intrinsic duty cycle displayed a strong positive correlation with the network duty cycle difference (R2 = 0.68). C: the difference between the intrinsic frequencies had only marginal effects on network phasing in the models (R2 = 0.08). D: voltage traces showing intrinsic oscillator activity and network activity. Chemical and electrical coupling were absent at the beginning of each trace (see schematics above traces) and were inserted into the model at the time points marked by the arrows. Scale bars = 30 mV and 500 ms. The left trace shows oscillators with similar intrinsic duty cycles but different intrinsic frequencies. When coupled, the oscillators continued to display similar duty cycles. Model parameters were as follows: top oscillator [maximal conductance for Ca2+ current (gCa), 65.5; maximal conductance for K+ current (gK), 80.5; maximal conductance for leak current (gL), 2.41; and maximal conductance for excitatory chemical synapses (gsyn), 22.3], bottom oscillator (gCa, 19.6; gK, 58.1; gL, 9.15; and gsyn, 0.785), and electrical coupling [strength of electrical coupling (ggap), 36.3]. The right trace shows oscillators with similar intrinsic frequencies but different intrinsic duty cycles. Once coupled, the oscillators displayed disparate duty cycles. Model parameters were as follows: top oscillator (gCa, 24.8; gK, 93.6; gL, 1.87; and gsyn, 5.25), bottom oscillator (gCa, 63.5; gK, 62.6; gL, 7.62; and gsyn, 2.67), and electrical coupling (ggap, 11.9).
Fig. 6.
Fig. 6.
The proportion gCa/gK and the electrical coupling influence the phasing of network activity. A: gCa/gK displayed a strong nonlinear relationship with the intrinsic duty cycle (cubic regression, R2 = 0.72, n = 26,282). B: the difference between gCa/gK in two oscillators predicts the duty cycle difference for those oscillators when they are coupled (R2 = 0.71, n = 13,141). The color scheme shows that increasing the electrical coupling (ggap) decreased the slope of the relationship between gCa/gK and duty cycle difference.
Fig. 7.
Fig. 7.
Chemical synapses function to increase cycle frequency in networks with similar duty cycles but decrease cycle frequency in networks with disparate duty cycles. A and B: voltage traces of network activity with baseline parameters (middle), chemical synaptic strengths doubled (top), and chemical synapses silenced (bottom). Scale bars = 500 ms and 50 mV. A: network with similar duty cycles in the baseline simulation. Increasing the synaptic strength increased cycle frequency. Baseline model parameters were as follows: top oscillator (gCa, 57.7; gK, 64.5; gL, 3.81; and gsyn, 24.5), bottom oscillator (gCa, 12.4; gK, 12.3; gL, 7.98; and gsyn, 16.1), and electrical coupling (ggap, 27.9). B: network with disparate duty cycles in the baseline simulation. Increasing synaptic strength decreased cycle frequency. Baseline model parameters were as follows: top oscillator (gCa, 73.0; gK, 96.6; gL, 1.63; and gsyn, 2.99), bottom oscillator (gCa, 73.4; gK, 79.1; gL, 6.39; and gsyn, 17.0), and electrical coupling (ggap, 6.1). C: the initial duty cycle difference predicted whether cycle frequency increases or decreases in response to silencing the chemical synapses (n = 12,946). As the absolute value of duty cycle difference increased, the change in cycle frequency changed from negative to positive. D: the initial duty cycle difference predicted how the duty cycle changes in response to silencing the chemical synapses (n = 12,946). Silencing the chemical synapses tended to make the duty cycles more similar. If the duty cycle difference was initially positive, then silencing the synapses tended to produce a negative change, and vice versa. The color scheme in C and D shows the mean strength of the two chemical synapses. The magnitude of the effect of silencing the synapses was positively related to the initial synaptic strengths (larger changes in frequency and duty cycle for stronger initial synapses). The n values here were less than the original simulation set because we excluded networks that failed to meet our criteria with the synapses turned off.
Fig. 8.
Fig. 8.
Modifying the reversal potential of the chemical synapses substantially affects how the chemical synapses control network frequency. A: locations of the four reversal potentials tested (−15, 0, 15, and 45 mV) on the activation curve of the chemical synaptic current. Letters correspond to the panels of the corresponding reversal potential. B: locations of the six reversal potentials tested on a histogram showing the voltage minima and maxima of all oscillators within the model networks. Chemical synapses were turned off in the simulations used to gather these data. Letters indicate the panels corresponding to each reversal potential. C–F: relationships between the differences in duty cycle and changes in cycle frequency in response to silencing the chemical synapses for each reversal potential. For consistency, all plots contained exactly 10,000 points, which were randomly chosen from simulations in each condition. C: gsyn = −15 mV (same as baseline parameters). D: gsyn = 0 mV. E: gsyn = 15 mV. F: gsyn = 45 mV.
Fig. 9.
Fig. 9.
Qualitative explanation of how chemical synapses can differentially influence cycle frequency based on network phasing. Green portions of the traces mark periods where the postsynaptic current is active and acting to hyperpolarize membrane potential. Red portions of the traces mark periods where the postsynaptic current is active and acting to depolarize membrane potential. Black dotted lines mark burst threshold (0 mV). Magenta dotted lines mark the synaptic reversal potential (−15 mV). Scale bars = 500 ms and 30 mV. A: network with similar duty cycles, in which cycle frequency decreased after chemical synapses were removed. Model parameters were as follows: top oscillator (gCa, 46.8; gK, 48.4; gL, 3.07; and gsyn, 37.28), bottom oscillator (gCa, 27.7; gK, 30.6; gL, 6.72; and gsyn, 14.7), and electrical coupling (ggap, 35.2). B: network with disparate duty cycles, in which cycle frequency increased after chemical synapses were removed. Model parameters were as follows: top oscillator (gCa, 77.6; gK, 73.9; gL, 8.74; and gsyn, 25.9), bottom oscillator (gCa, 69.6; gK, 91.5; gL, 9.68; and gsyn, 1.94), and electrical coupling (ggap, 35.2).

References

    1. Amendola J, Woodhouse A, Martin-Eauclaire MF, Goaillard JM. Ca2+/cAMP-sensitive covariation of IA and IH voltage dependences tunes rebound firing in dopaminergic neurons. J Neurosci 32: 2166–2181, 2012 - PMC - PubMed
    1. Ball JM, Franklin CC, Tobin AE, Schulz DJ, Nair SS. Coregulation of ion channel conductances preserves output in a computational model of a crustacean cardiac motor neuron. J Neurosci 30: 8637–8649, 2010 - PMC - PubMed
    1. Berens P. Journal of Statistical Software. CircStat: a Matlab Toolbox for Circular Statistics (online). http://www.jstatsoft.org/v31/i10 [7 March 2013].
    1. Berlind A. Heterogeneity of motorneuron driver potential properties along the anterior-posterior axis of the lobster cardiac ganglion. Brain Res 609: 51–58, 1993 - PubMed
    1. Bucher D, Prinz AA, Marder E. Animal-to-animal variability in motor pattern production in adults and during growth. J Neurosci 25: 1611–1619, 2005 - PMC - PubMed

Publication types

LinkOut - more resources