. 2013 Jul;7(7):1299-309.
doi: 10.1038/ismej.2013.29. Epub 2013 Feb 28.

The biogeography of fungal communities in wetland sediments along the Changjiang River and other sites in China

Affiliations

The biogeography of fungal communities in wetland sediments along the Changjiang River and other sites in China

Bing Wu et al. ISME J. 2013 Jul.

Abstract

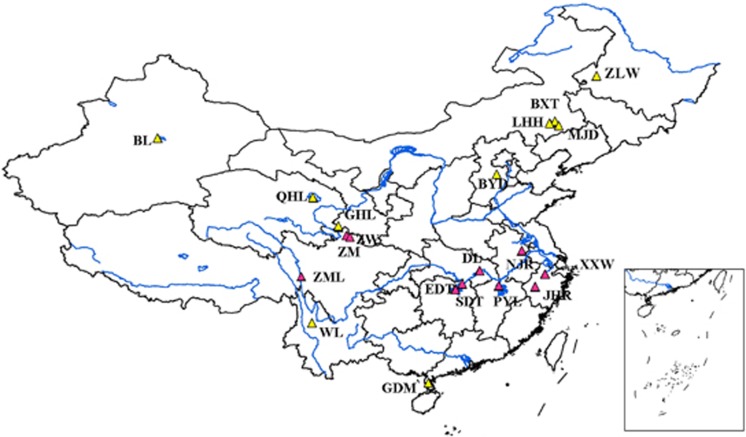
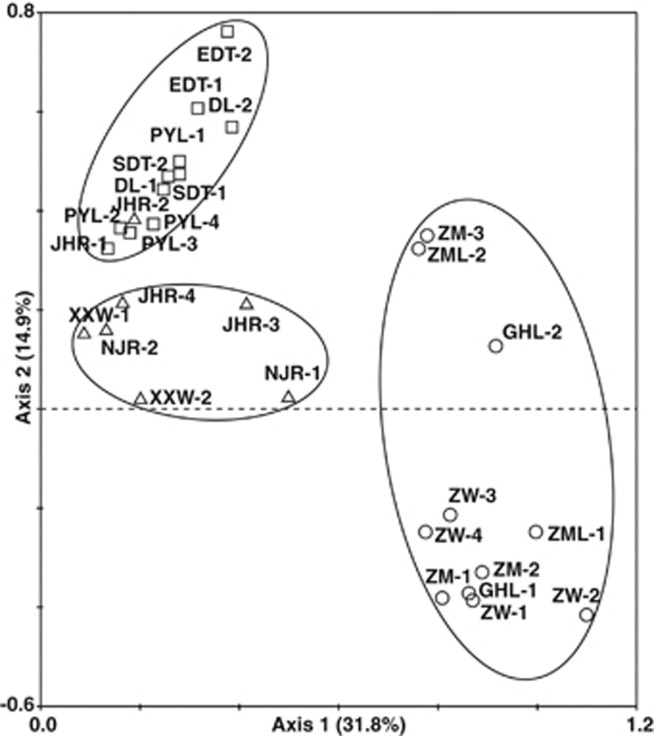
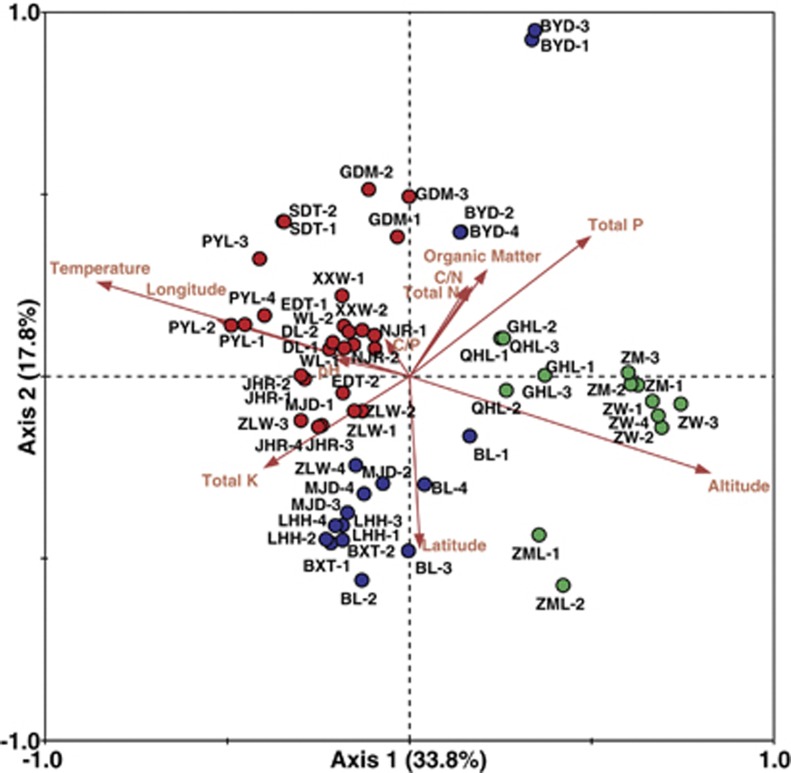
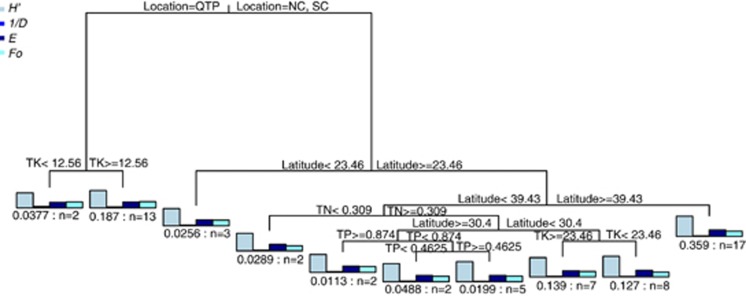
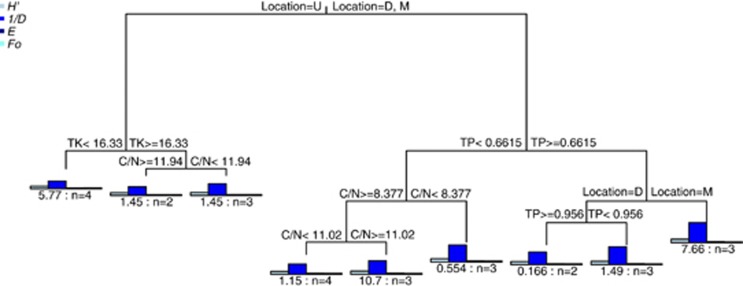
Whether fungal community structure depends more on historical factors or on contemporary factors is controversial. This study used culture-dependent and -independent (polymerase chain reaction-denaturing gradient gel electrophoresis (PCR-DGGE)) methods to assess the influence of historical and contemporary factors on the distributions of fungi in the wetland sediments at 10 locations along the Changjiang River and at 10 other locations in China. The culture-dependent approach detected greater species diversity (177 operational taxonomic units (OTUs)) than PCR-DGGE analysis (145 OTUs), and the species in the genera of Penicillium (relative frequency=16.8%), Fusarium (15.4%), Aspergillus (7.6%), Trichoderma (5.8%) and Talaromyces (4.2%) were dominant. On the basis of DGGE data, fungal diversity along the Changjiang River increased from upstream to downstream; altitude explained 44.8% of this variation in diversity. And based on the data from all 20 locations, the fungal communities were geographically clustered into three groups: Southern China, Northern China and the Qinghai-Tibetan Plateau. Multivariate regression tree analysis for data from the 20 locations indicated that the fungal community was influenced primarily by location (which explained 61.8% of the variation at a large scale), followed by total potassium (9.4%) and total nitrogen (3.5%) at a local scale. These results are consistent with the concept that geographic distance is the dominant factor driving variation in fungal diversity at a regional scale (1000-4000 km), whereas environmental factors (total potassium and total nitrogen) explain variation in fungal diversity at a local scale (<1000 km).


Figures

Figure 1
Figure 1
Geographic distribution of the wetland sites. Codes on the map are described in detail in Table 1. Pink triangles represent the sampling areas along the Changjiang River and yellow triangles represent wetlands at other sites in China. A full color version of this figure is available at the ISME Journal online.
Figure 2
Figure 2
PCA analysis based on DGGE profiles of the fungal communities along the Changjiang River. Each point indicates a sampling area in wetlands. Distances between any two points on the graph indicate the ecological distance between the community compositions. Numbers within parentheses are the percentage variance explained by each principal component. Circles, squares and triangles indicate samples from upstream, midstream and downstream locations, respectively, along the Changjiang River.
Figure 3
Figure 3
Relationships between fungal communities and environmental factors according to RDA based on DGGE profiles. Symbols indicate different sampling areas in wetlands, and the arrows indicate the types of environmental factors and their relative effects on fungal communities. The distance between symbols reflects their dissimilarity, and the relative position (in perpendicular distance) of a symbol to an arrow-line indicates the influence of the specified environmental factor on the fungal communities in different wetlands. Red, blue and green circles indicate samples from Southern China, Northern China and the Qinghai-Tibetan Plateau, respectively. A full color version of this figure is available at the ISME Journal online.
Figure 4
Figure 4
MRT of the fungal diversity data associated with a total of 61 different sampling locations (Southern China, Northern China and the Qinghai-Tibetan Plateau) and environmental variables (organic carbon content, organic matter, total nitrogen, total potassium, total phosphorus, C:N ratio, C:P ratio, pH and temperature). Each split in the figure was represented graphically as a branch in a tree. Bar plots show the multivariate means of diversity estimates at each branch. The numbers of samples included in that splits are shown under bar plots. The average of the replications was applied for each sampling location. The standardized diversity estimates were used to construct the MRT. SC, Southern China; NC, Northern China; QTP, the Qinghai-Tibetan Plateau; OCC, organic carbon content; OM, organic matter; TN, total nitrogen; TK, total potassium; TP, total phosphorus; C/N, C:N ratio; C/P, C:P ratio. A full color version of this figure is available at the ISME Journal online.
Figure 5
Figure 5
MRT of environmental factors on the patterns of fungal community structure along the Changjiang River. Fungal community structure was indicated by H′, 1/D, E and Fo. The environmental factors included different sampling locations (upstream, midstream and downstream of the Changjiang River) and environmental variables (organic carbon content, organic matter, total nitrogen, total potassium, total phosphorus, C:N ratio, C:P ratio, pH and temperature). Each split in the figure was represented graphically as a branch in a tree. Bar plots show the multivariate means of diversity estimates at each branch. The numbers of samples included in that splits are shown under bar plots. The average of the replications was applied for each sampling location. U, M and D refer to upstream, midstream and downstream of the Changjiang River, respectively. OCC, organic carbon content; OM, organic matter; TN, total nitrogen; TK, total potassium; TP, total phosphorus; C/N, C:N ratio; C/P, C:P ratio. A full color version of this figure is available at the ISME Journal online.

References

    1. Bates ST, Nash TH, Garcia-Pichel F. Patterns of diversity for fungal assemblages of biological soil crusts from the southwestern United States. Mycologia. 2012;104:353–361. - PubMed
    1. Beijerinck M. De Infusies en de Ontdekking der Backterien, Jaarboek van de Koninklijke Akademie v. Wetenschappen, Muller: Amsterdam, Netherlands; 1913.
    1. Brown JKM, Hovmoller MS. Epidemiology—aerial dispersal of pathogens on the global and continental scales and its impact on plant disease. Science. 2002;297:537–541. - PubMed
    1. Buée M, Reich M, Murat C, Morin E, Nilsson RH, Uroz S, et al. 454 Pyrosequencing analyses of forest soils reveal an unexpectedly high fungal diversity. New Phytol. 2009;184:449–456. - PubMed
    1. Bärlocher F, Stewart M, Ryder DS. Analyzing aquatic fungal communities in Australia: impacts of sample incubation and geographic distance of streams. Czech Mycol. 2011;63:113–132.

Publication types