Review
. 2013 Feb 27;13(3):2786-801.
doi: 10.3390/s130302786.

Contactless impedance sensors and their application to flow measurements

Affiliations
Review

Contactless impedance sensors and their application to flow measurements

František Opekar et al. Sensors (Basel). .

Abstract

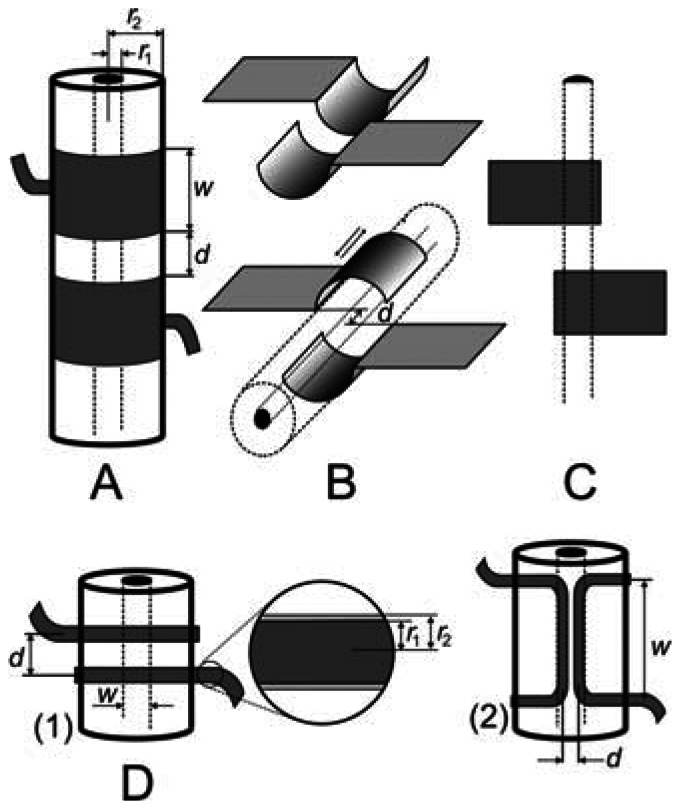
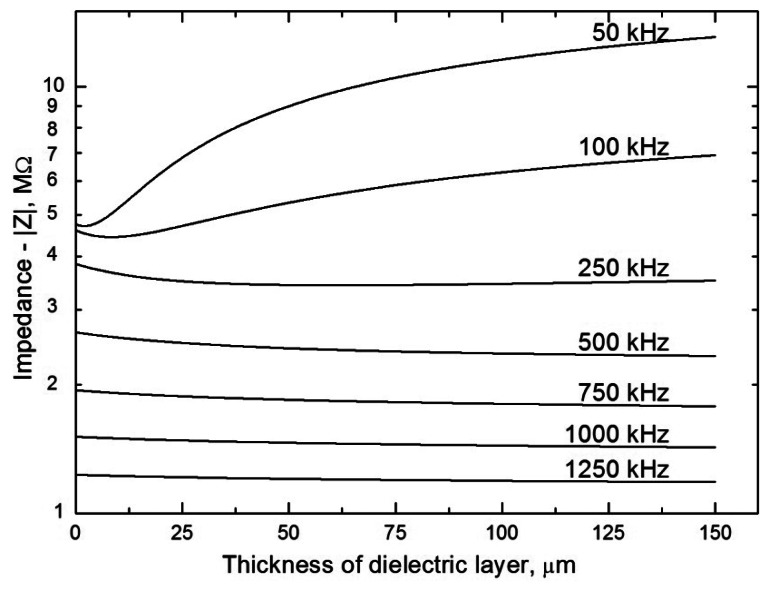
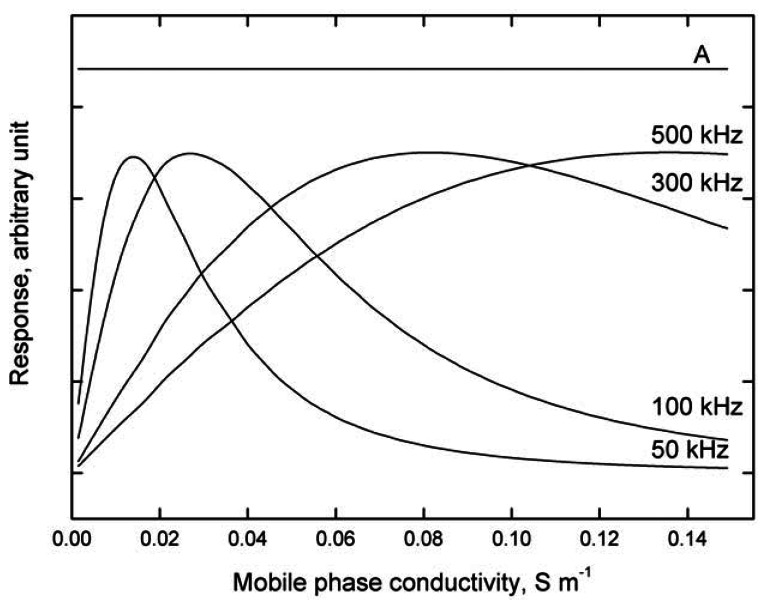
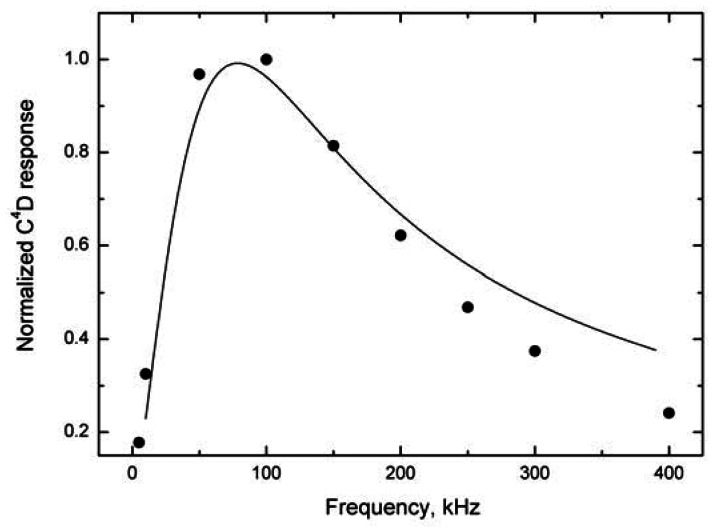
The paper provides a critical discussion of the present state of the theory of high-frequency impedance sensors (now mostly called contactless impedance or conductivity sensors), the principal approaches employed in designing impedance flow-through cells and their operational parameters. In addition to characterization of traditional types of impedance sensors, the article is concerned with the use of less common sensors, such as cells with wire electrodes or planar cells. There is a detailed discussion of the effect of the individual operational parameters (width and shape of the electrodes, detection gap, frequency and amplitude of the input signal) on the response of the detector. The most important problems to be resolved in coupling these devices with flow-through measurements in the liquid phase are also discussed. Examples are given of cell designs for continuous flow and flow-injection analyses and of detection systems for miniaturized liquid chromatography and capillary electrophoresis. New directions for the use of these sensors in molecular biology and chemical reactors and some directions for future development are outlined.


Figures

Figure 1.
Figure 1.
A simplified scheme of the equivalent electric circuit for the contactless impedance cell with connections to the input high-frequency voltage source and the output signal meter. For discussion and symbols explanation see the text.
Figure 2.
Figure 2.
Examples of contactless impedance cell designs used mostly for conductometric detection. (A) tubular electrodes; (B) semitubular electrodes placed either in series or opposite one other; (C) planar electrodes; (D) insulated wire electrodes oriented across the tube (1) or placed axially inside the tube (2). w—geometric length of the electrode; d—width of the gap between the electrodes; r1 and r2—the inner and outer radii of the tube (capillary) with the test solution or the radii of the bare wire and the wire with the insulating film.
Figure 3.
Figure 3.
Examples of contactless impedance cell designs used mostly for dielectrometric detection. (A) planar electrodes oriented opposite one other; (B) flow-through cell with semitubular electrodes on the outside tube wall; (C) dipping cell with cylindrical electrodes placed one above the other.
Figure 4.
Figure 4.
Model dependences of the impedance on the electrode width for various input voltage frequencies (specified next to the curves, in kHz); all the model calculations are based on the equivalent circuit in Figure 1. The modelling parameters are: silica capillary, r1 = 37.5 μm, r2 = 190 μm, εr = 4.3; d = 1 mm and Cx = 0.1 pF (estimated); the capillary is filled with 20 mM morpholinoethanesulfonic acid/histidine (MES/His) solution (pH 6.1), conductivity κ = 4.7 × 10⁻² S m−1. Because of the large difference in the absolute values of the impedance, |Z|, the dependences are depicted in normalized form for the individual frequencies, |Z| = 1 for w → 0.
Figure 5.
Figure 5.
Electropherogram of K+ (1) ion and water gap (2) obtained using the detection cell with semi-tubular electrodes placed opposite one another with a 1 mm gap between them, 50 μM K+ (A, thick line), and with electrodes completely overlapped, 500 μM K+ (B). Fused silica capillary, 75 μm i.d., total length/length to detector, 58 cm/50 cm, background electrolyte, 20 mM MES/His, separation voltage/current, 20 kV/11 μA, hydrodynamic sampling, 10 cm/10 s, C4D, 300 kH/4.5 Vpp.
Figure 6.
Figure 6.
Model dependences of the impedance on the thickness of the dielectric layer in the range from 0.1 to 150 μm for various input voltage frequencies (specified next to the curves, in kHz). Model calculations are based on the equivalent circuit in Figure 1, which was employed for a tubular cell (Figure 2A). The modeling parameters are: silica capillary, inner diameter r1 = 37.5 μm, thickness of capillary wall 0.1–150 μm, εr (fused-silica) = 4.3; d = 1 mm, w = 2 mm and Cx = 0.1 pF (estimated); the capillary is filled with 20 mM MES/His solution, conductivity κ = 4.7 × 10⁻² S m−1.
Figure 7.
Figure 7.
Model dependence of the detector response to a sample with constant conductivity introduced into carrier solutions with various conductivities, at various input voltage frequencies. For comparison, the response produced by cell with purely ohmic resistance is given by straight line A. The modeling parameters are: carrier liquid conductance, κE, in a range from 1.5 × 10⁻³ to 1.5 × 10⁻¹ S m−1 (corresponding to ca. 10−4 to 10−2 M KCl); analyte conductance, and κA = 1.5 × 10⁻⁴ S m−1 (corresponding to ca. 10−5 M KCl); the detected conductance equals κE + κA, w = 2 mm; for the other parameters, see Figure 4.
Figure 8.
Figure 8.
The model (solid line) and experimental (points) dependences of the insulated wire cell response on the input voltage frequency; electrodes placed at right angles to the test liquid flow, Figure 2D (1). The modeling parameters are: r1 = 4.5 × 10⁻⁵ m, r2 = 5 × 10⁻⁵ m (difference r2r1 is the dielectric thickness), w = 2.54 × 10⁻⁴ m (the electrode length equals the internal diameter of the PTFE tubing), d = 4 × 10⁻⁴ m, εr = 4 (polyimide insulating film), carrier liquid conductance κE = 7.5 × 10⁻⁵ S m−1 (5 × 10⁻⁶ M KCl), analyte zone conductance κA = 1.5 × 10⁻³ S m−1 (10−4 M KCl) and the capacitance used in the model Cx = 1 pF (estimated). The cell geometry is modeled from the relationship for the board capacitor [Equation (9)].

References

    1. Reilley C.N. High frequency methods. In: Delahay P., editor. New Instrumental Methods in Electrochemistry. Interscience; New York, NY, USA: 1954.
    1. Pungor E. Oscillometry and Conductometry. Pergamon Press; Oxford, UK: 1965.
    1. Kuban P., Timerbaev A.R. Ce of inorganic species—A review of methodological advancements over 2009–2010. Electrophoresis. 2012;33:196–210. - PubMed
    1. Kuban P., Hauser P.C. Capacitively coupled contactless conductivity detection for microseparation techniques—Recent developments. Electrophoresis. 2011;32:30–42. - PubMed
    1. Solinova V., Kasicka V. Recent applications of conductivity detection in capillary and chip electrophoresis. J. Sep. Sci. 2006;29:1743–1762. - PubMed

Publication types