

BreedVision--a multi-sensor platform for non-destructive field-based phenotyping in plant breeding
- PMID: 23447014
- PMCID: PMC3658717
- DOI: 10.3390/s130302830
BreedVision--a multi-sensor platform for non-destructive field-based phenotyping in plant breeding
Abstract
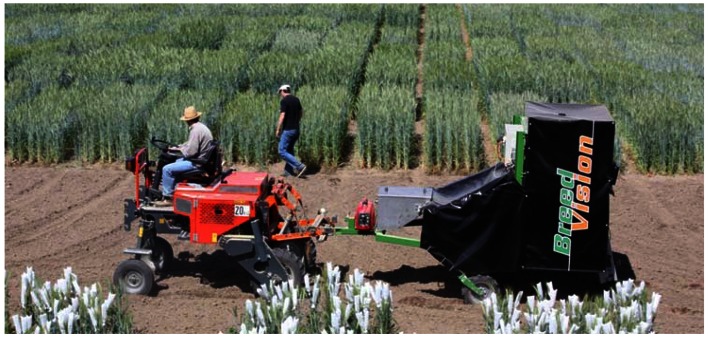
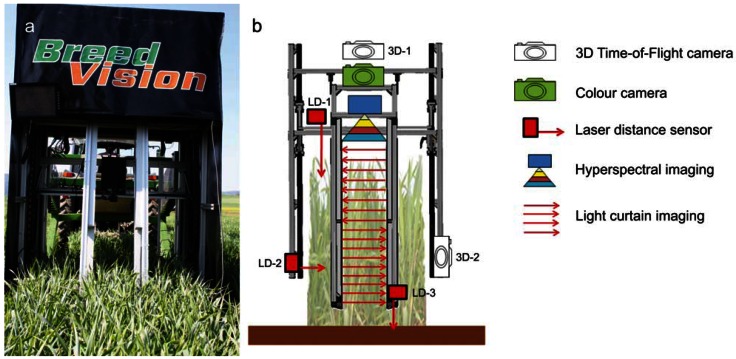
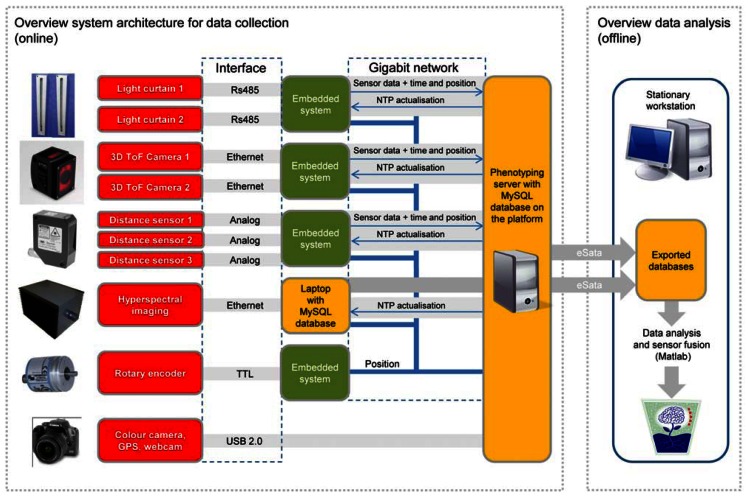
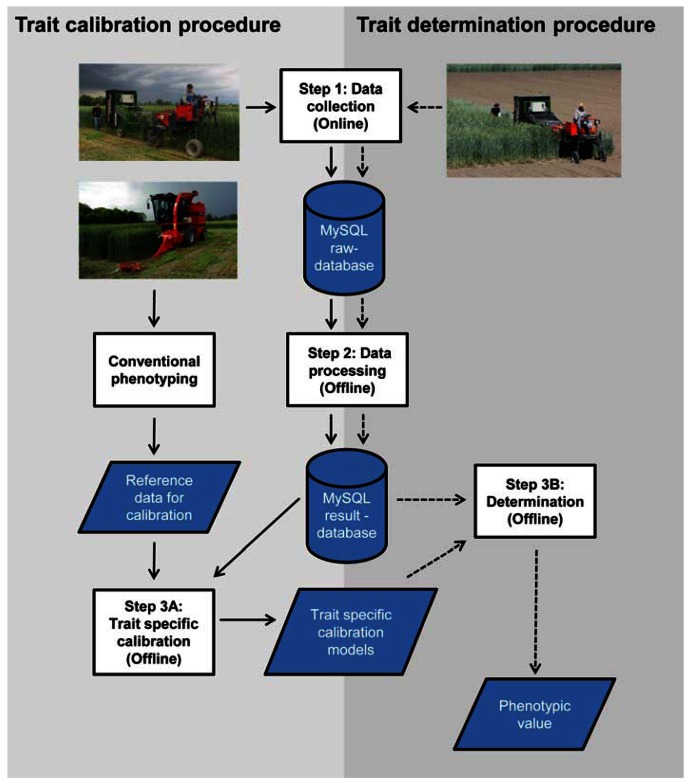
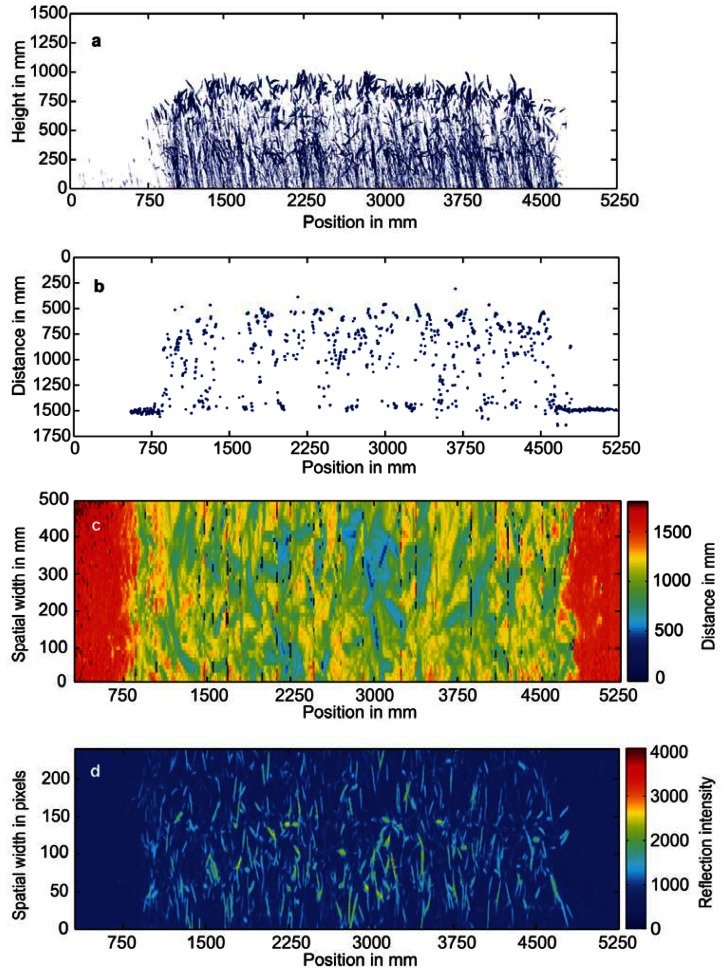
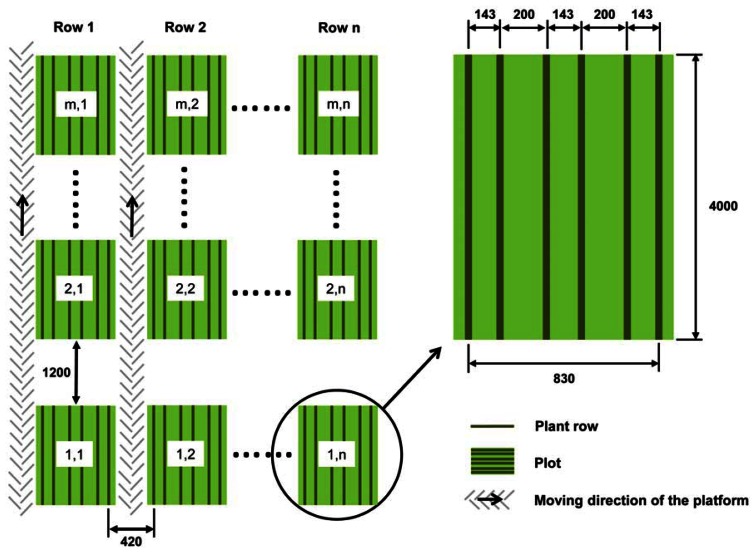
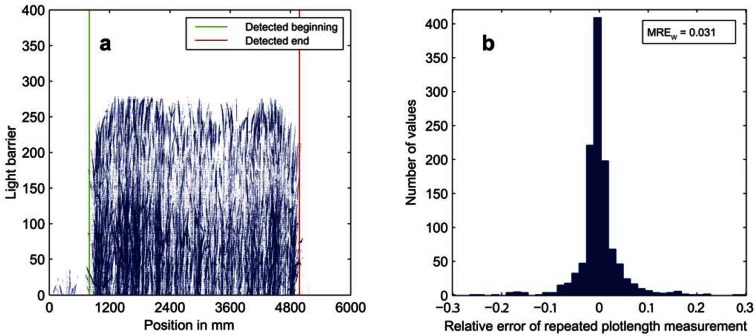
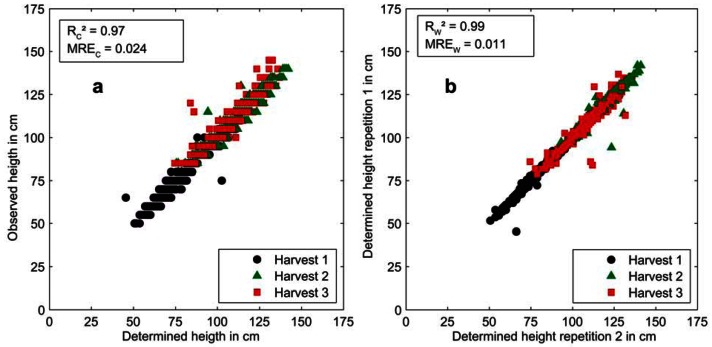
To achieve the food and energy security of an increasing World population likely to exceed nine billion by 2050 represents a major challenge for plant breeding. Our ability to measure traits under field conditions has improved little over the last decades and currently constitutes a major bottleneck in crop improvement. This work describes the development of a tractor-pulled multi-sensor phenotyping platform for small grain cereals with a focus on the technological development of the system. Various optical sensors like light curtain imaging, 3D Time-of-Flight cameras, laser distance sensors, hyperspectral imaging as well as color imaging are integrated into the system to collect spectral and morphological information of the plants. The study specifies: the mechanical design, the system architecture for data collection and data processing, the phenotyping procedure of the integrated system, results from field trials for data quality evaluation, as well as calibration results for plant height determination as a quantified example for a platform application. Repeated measurements were taken at three developmental stages of the plants in the years 2011 and 2012 employing triticale (×Triticosecale Wittmack L.) as a model species. The technical repeatability of measurement results was high for nearly all different types of sensors which confirmed the high suitability of the platform under field conditions. The developed platform constitutes a robust basis for the development and calibration of further sensor and multi-sensor fusion models to measure various agronomic traits like plant moisture content, lodging, tiller density or biomass yield, and thus, represents a major step towards widening the bottleneck of non-destructive phenotyping for crop improvement and plant genetic studies.
Figures
References
-
- Bruinsma J. The Resource Outlook to 2050: By How Much Do Land, Water and Crop Yields Need to Increase by 2050?. Proceedings of FAO Expert Meeting on How to Feed the World in 2050; Rome, Italy. 24–26 June 2009.
-
- Montes J.M., Melchinger A.E., Reif J.C. Novel throughput phenotyping platforms in plant genetic studies. Trends Plant Sci. 2007;12:433–436. - PubMed
-
- Furbank R.T., Tester M. Phenomics—Technologies to relieve the phenotyping bottleneck. Trends Plant Sci. 2011;16:635–644. - PubMed
-
- Xu Y., Crouch J.H. Marker-assisted selection in plant breeding: From publications to practice. Crop Sci. 2008;48:391–407.
Publication types
MeSH terms
LinkOut - more resources
Full Text Sources
Other Literature Sources
