. 2013 Mar 12;110(11):4321-6.
doi: 10.1073/pnas.1205575110. Epub 2013 Feb 27.

BCL2A1 is a lineage-specific antiapoptotic melanoma oncogene that confers resistance to BRAF inhibition

Affiliations

BCL2A1 is a lineage-specific antiapoptotic melanoma oncogene that confers resistance to BRAF inhibition

Rizwan Haq et al. Proc Natl Acad Sci U S A. .

Abstract

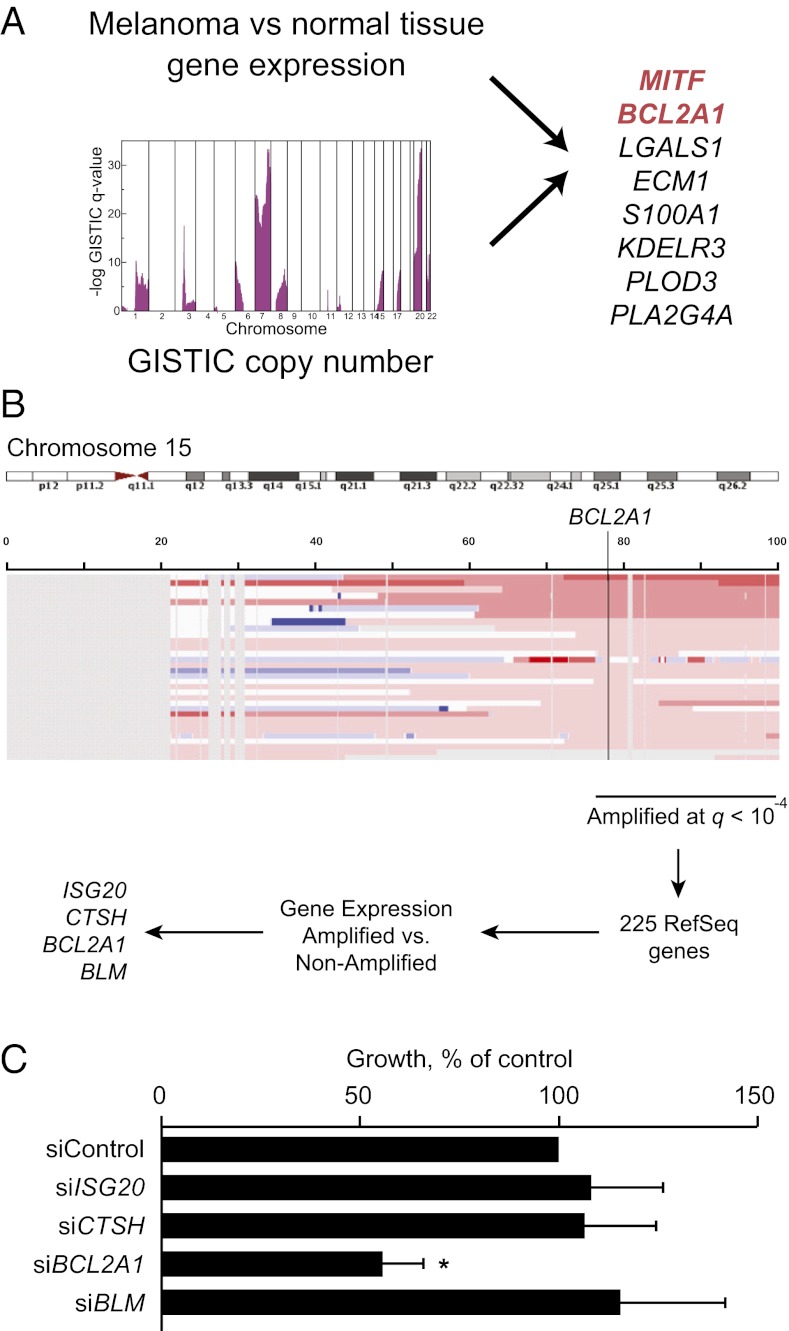
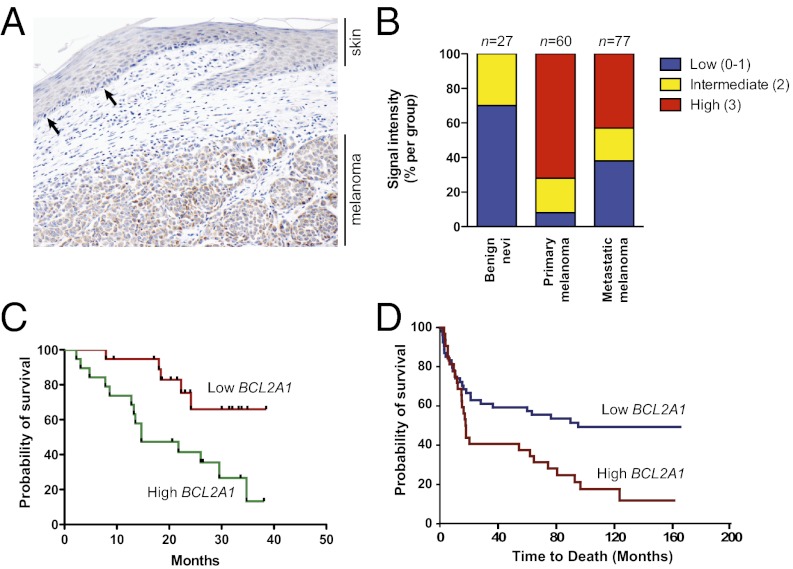
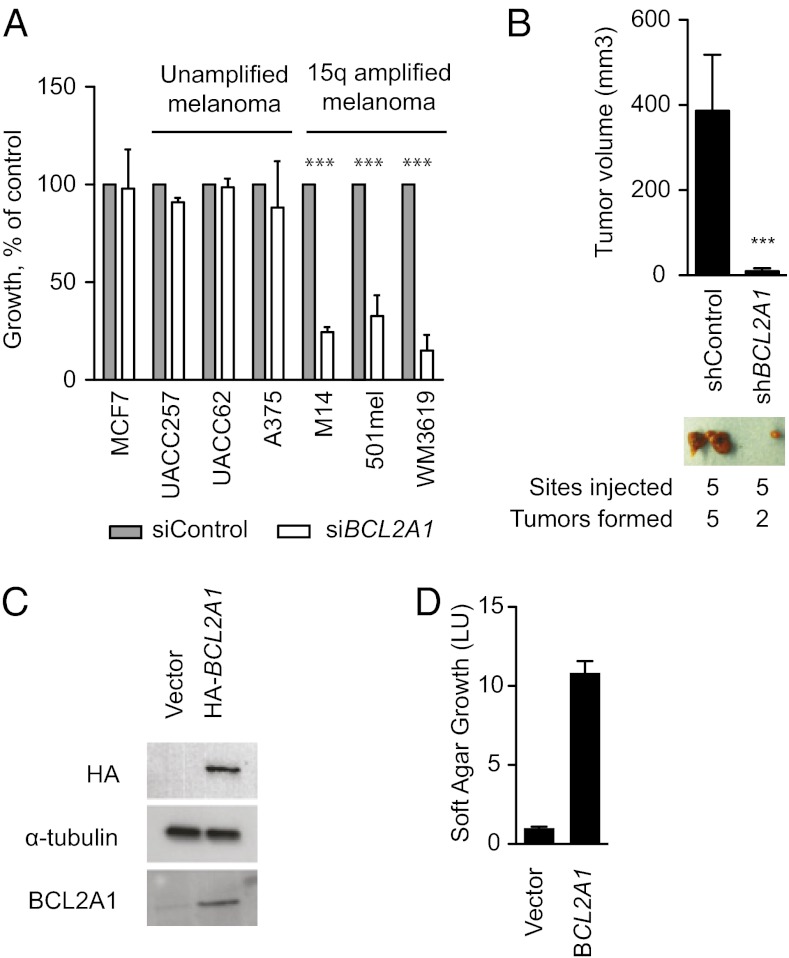
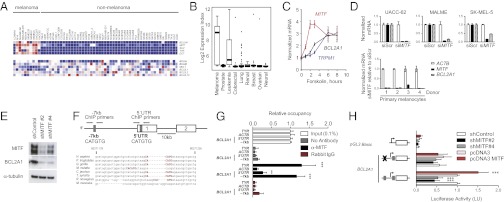
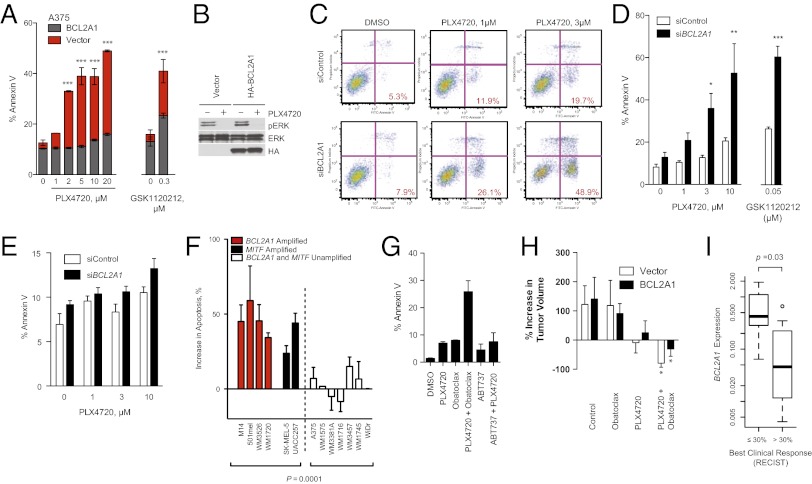
Although targeting oncogenic mutations in the BRAF serine/threonine kinase with small molecule inhibitors can lead to significant clinical responses in melanoma, it fails to eradicate tumors in nearly all patients. Successful therapy will be aided by identification of intrinsic mechanisms that protect tumor cells from death. Here, we used a bioinformatics approach to identify drug-able, "driver" oncogenes restricted to tumor versus normal tissues. Applying this method to 88 short-term melanoma cell cultures, we show that the antiapoptotic BCL2 family member BCL2A1 is recurrently amplified in ∼30% of melanomas and is necessary for melanoma growth. BCL2A1 overexpression also promotes melanomagenesis of BRAF-immortalized melanocytes. We find that high-level expression of BCL2A1 is restricted to melanoma due to direct transcriptional control by the melanoma oncogene MITF. Although BRAF inhibitors lead to cell cycle arrest and modest apoptosis, we find that apoptosis is significantly enhanced by suppression of BCL2A1 in melanomas with BCL2A1 or MITF amplification. Moreover, we find that BCL2A1 expression is associated with poorer clinical responses to BRAF pathway inhibitors in melanoma patients. Cotreatment of melanomas with BRAF inhibitors and obatoclax, an inhibitor of BCL2A1 and other BCL2 family members, overcomes intrinsic resistance to BRAF inhibitors in BCL2A1-amplified cells in vitro and in vivo. These studies identify MITF-BCL2A1 as a lineage-specific oncogenic pathway in melanoma and underscore its role for improved response to BRAF-directed therapy.


Conflict of interest statement

The authors declare no conflict of interest.

Figures

Fig. 1.
Fig. 1.
Scheme for identification of unique amplified oncogenic targets. (A) Diagram showing intersection of amplified genes that were significantly increased in melanoma compared with pooled normal tissues. (B) Approach for identification of oncogenes located on chromosome 15q. Eighty-eight melanomas with copy number analysis and gene expression were analyzed by GISTIC analysis and filtered for higher expression in 15q-amplified versus nonamplified melanomas (P < 0.05, Wilkcoxon test). (C) Dependence of M14 melanoma cell line on BCL2A1 and other candidate genes located in the 15q amplicon. M14 cells were transfected with siRNA targeting BCL2A1 or control. Colony formation is normalized to control siRNA 72 h after transfection. Data represent an average of at least six independent experiments with reported SE. *P < 0.05 versus siControl.
Fig. 2.
Fig. 2.
BCL2A1 is dysregulated in melanoma. (A) A primary melanoma with overlying attenuated overlying epidermis was stained with anti-BCL2A1. The arrows show examples of intraepidermal melanocytes, which uniformly have weak BCL2A1 staining, whereas most melanoma cells have robust BCL2A1 expression. (B) Melanoma progression array showing correlation of BCL2A1 staining with tumor progression. High BCL2A1 mRNA (C) or staining (D) is associated with poorer overall survival of stage III and stage IV melanoma patients (P = 0.0076 and P = 0.0064, respectively).
Fig. 3.
Fig. 3.
Requirement of BCL2A1 for melanoma growth. (A) Colony formation assay of cell lines 72 h after transfection with siRNA targeting BCL2A1. Results are normalized to control siRNA. Data represent an average of at least three independent experiments with SE. ***P < 0.001 compared with siControl. (B) Effect of BCL2A1 knockdown on growth of M14 melanoma xenotransplants. Volume of tumors was determined 12 d after injection. Representative tumors from mice are shown for each shRNA. (C) Expression of HA-tagged BCL2A1 in pmel*BRAF(V600E) (21) detected by Western blotting. (D) BCL2A1 overexpression promotes soft-agar growth in oncogenic BRAF-transformed melanocytes. Cell number was determined after 2 wk.
Fig. 4.
Fig. 4.
MITF directly regulates BCL2A1 in the melanocytic lineage. Expression of antiapoptotic BCL-2 family members, MITF, and MITF-regulated targets in (A) the NCI-60 tumor panel and (B) an independent dataset of 954 cancer cell lines (GlaxoSmithKline). (C) The cAMP agonist forskolin (20 µM) induces MITF, TRPM1 (a known MITF target), and BCL2A1 mRNA. A representative of three independent experiments using different donors is shown. (D) Knockdown of MITF by siRNA suppresses BCL2A1 expression in melanoma cells and primary melanocytes of different donors. Indicated RNA was quantified 72 h after siRNA transfection. (E) Knockdown of MITF by two independent lentiviral-expressed shMITFs suppresses BCL2A1 in UACC-62 melanoma cells. (F) Genomic structure of BCL2A1 promoter with conserved E-box at −7 kb site and within 5′UTR (gray boxes), showing exons 1 and 2 and location of primers used for chromatin precipitation. Below, alignment of the BCL2A1 promoter among mammalian species at the −7 kb site, based on Feb 2009 Build. (G) Chromatin immunopreciptation of indicated genomic region with no antibody, anti-MITF, or rabbit IgG. Precipitated DNA was amplified using primers surrounding the −7 kb or 5′UTR E-boxes. Results are normalized to input DNA. ***P < 0.001 compared with rabbit IgG control; **P < 0.01. (H) BCL2A1 promoters were cloned upstream of the luciferase gene as indicated. UACC-62 cells were transfected with the indicated promoters and two distinct shRNA hairpins targeting MITF (#2 and #4). Forty-eight hours later, luciferase activity was determined. Results reported are averages of at least three independent experiments, performed in duplicate and normalized for transfection efficiency using Renilla luciferase. All data are normalized to the wild-type BCL2A1 promoter transfected with the control. ***P < 0.001 compared with control.
Fig. 5.
Fig. 5.
BCL2A1 and MITF mediate resistance to BRAF-directed therapy. (A) BRAF-mutant A375 melanoma cells with overexpressed BCL2A1 were treated with PLX4720 or GSK1120212 and apoptosis was measured by Annexin V staining after 48 h of drug treatment. (B) Effect of BCL2A1 overexpression on ERK signaling after 4 h of treatment with 3 µM PLX4720. (C) Effect of concomitant BCL2A1 suppression by siRNA and PLX4720 in BCL2A1 amplified cell line, M14. Quantification of three independent experiments is shown in D. (E) Effect of siBCL2A1 and PLX4720 in BRAF-wild-type (15q-unamplified) cell line MeWo. (F) Effect of siBCL2A1 and PLX4720 (3 µM) on apoptosis in cell lines and short-term cultures. WDir is a colon cancer cell line with BRAF V600E mutation. (G) Effect of obatoclax (100 nM), ABT-737 (1 µM), and PLX4720 (3 µM) on apoptosis of BCL2A1-amplified cell line 501mel after 48 h of treatment. (H) Effect of PLX4720 alone or in combination with obatoclax in mouse xenotransplants. A375 cells expressing BCL2A1 or control vector (five biological replicates each) were injected into mice. Treatment of mice began 12 d after implantation, and tumor volume was measured at baseline and on the 12th d of treatment. *P < 0.05 compared with control. (I) Box-whisker plot comparing BCL2A1 mRNA expression in melanomas from patients before treatment with vemurafenib or GSK1120212 + GSK2118436 (SI Appendix, Table S4). Normalized expression (arbitrary units) was compared in patients who achieved objective responses by standard RECIST criteria (n = 12) versus those without objective responses (n = 7).

Comment in

  • Improving apoptotic responses to targeted therapy.
    Haq R, Fisher DE. Haq R, et al. Oncotarget. 2013 Sep;4(9):1331. doi: 10.18632/oncotarget.1261. Oncotarget. 2013. PMID: 23934756 Free PMC article. No abstract available.
  • Evolution of resistance to thyroid cancer therapy.
    Nucera C. Nucera C. Aging (Albany NY). 2016 Aug;8(8):1576-7. doi: 10.18632/aging.101030. Aging (Albany NY). 2016. PMID: 27575377 Free PMC article. No abstract available.
  • In Reply.
    Aziz MF, Healy DW, Brambrink AM, Kheterpal S. Aziz MF, et al. Anesthesiology. 2017 Jul;127(1):202-203. doi: 10.1097/ALN.0000000000001692. Anesthesiology. 2017. PMID: 28632626 No abstract available.

References

    1. Wan PT, et al. Cancer Genome Project Mechanism of activation of the RAF-ERK signaling pathway by oncogenic mutations of B-RAF. Cell. 2004;116(6):855–867. - PubMed
    1. Dhomen N, et al. Oncogenic Braf induces melanocyte senescence and melanoma in mice. Cancer Cell. 2009;15(4):294–303. - PubMed
    1. Dankort D, et al. Braf(V600E) cooperates with Pten loss to induce metastatic melanoma. Nat Genet. 2009;41(5):544–552. - PMC - PubMed
    1. Joseph EW, et al. The RAF inhibitor PLX4032 inhibits ERK signaling and tumor cell proliferation in a V600E BRAF-selective manner. Proc Natl Acad Sci USA. 2010;107(33):14903–14908. - PMC - PubMed
    1. Solit DB, et al. BRAF mutation predicts sensitivity to MEK inhibition. Nature. 2006;439(7074):358–362. - PMC - PubMed

Publication types

MeSH terms

Substances