. 2013 Mar 19;110(12):E1122-31.
doi: 10.1073/pnas.1300392110. Epub 2013 Feb 27.

Host DNA released in response to aluminum adjuvant enhances MHC class II-mediated antigen presentation and prolongs CD4 T-cell interactions with dendritic cells

Affiliations

Host DNA released in response to aluminum adjuvant enhances MHC class II-mediated antigen presentation and prolongs CD4 T-cell interactions with dendritic cells

Amy S McKee et al. Proc Natl Acad Sci U S A. .

Abstract

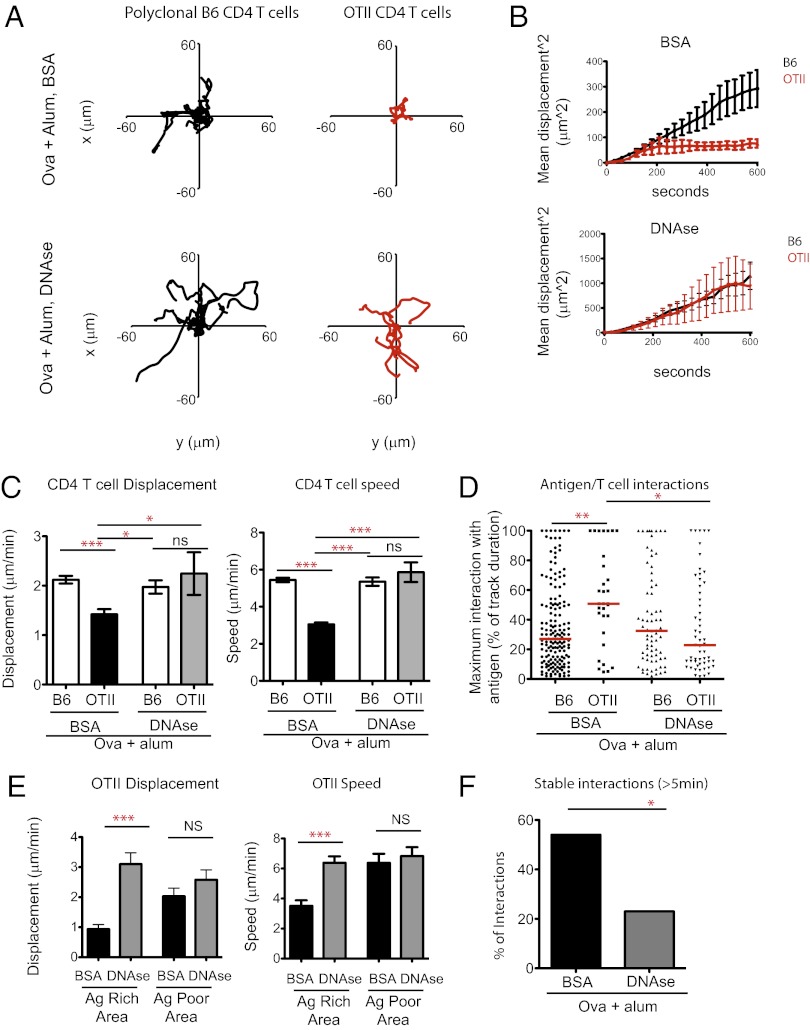
Many vaccines include aluminum salts (alum) as adjuvants despite little knowledge of alum's functions. Host DNA rapidly coats injected alum. Here, we further investigated the mechanism of alum and DNA's adjuvant function. Our data show that DNase coinjection reduces CD4 T-cell priming by i.m. injected antigen + alum. This effect is partially replicated in mice lacking stimulator of IFN genes, a mediator of cellular responses to cytoplasmic DNA. Others have shown that DNase treatment impairs dendritic cell (DC) migration from the peritoneal cavity to the draining lymph node in mice immunized i.p. with alum. However, our data show that DNase does not affect accumulation of, or expression of costimulatory proteins on, antigen-loaded DCs in lymph nodes draining injected muscles, the site by which most human vaccines are administered. DNase does inhibit prolonged T-cell-DC conjugate formation and antigen presentation between antigen-positive DCs and antigen-specific CD4 T cells following i.m. injection. Thus, from the muscle, an immunization site that does not require host DNA to promote migration of inflammatory DCs, alum acts as an adjuvant by introducing host DNA into the cytoplasm of antigen-bearing DCs, where it engages receptors that promote MHC class II presentation and better DC-T-cell interactions.


Conflict of interest statement

The authors declare no conflict of interest.

Figures

Fig. 1.
Fig. 1.
DNase treatment impairs primary CD4 T-cell and Ab responses following immunization with aluminum adjuvant. (A) B6 mice (four per group) were immunized with 10 μg of 3K-ova ± 1 mg of Alhydrogel (alum) in the calf muscle, and LNs were harvested at various times thereafter and stained with tetramers and Abs as described in Materials and Methods to quantify the number of 3K/IAb tetramer-positive T cells. (B) B6 mice (four per group) were immunized with 10 μg of 3K-ova ± 200 μg of Alhydrogel (alum) in the calf muscle. Before injection, the antigen/adjuvant was mixed with either PBS; 0.8 mg of BSA; or 0.2, 0.4, or 0.8 mg of DNase I as indicated. Popliteal LNs were harvested 7 d after immunization and stained with tetramers and Abs as described in Materials and Methods. Bars on the graphs in A and B show the mean total number of 3K/IAb tetramer-positive CD44hi CD4 T cells per mouse. Error bars show SEM for each group. (C) B6 mice were immunized with 10 μg of ova (Ova) ± 200 μg of Alhydrogel in the calf muscle. Before injection, the antigen/adjuvant was mixed with PBS or 5 mg of BSA or DNase I. Sera were tested for the presence of ova-specific Abs 14 d later. At this time, the predominant Ab isotype is IgG1. RU, relative units. Data in A are from a single representative experiment of two, data in B are from a single representative experiment of three, and data in C are from a single representative experiment of two. Statistical differences were determined using one-way ANOVA with a Bonferroni posttest. *P < 0.05; **P < 0.01; ***P < 0.001; not significant (ns) indicates P > 0.05 for select comparisons.
Fig. 2.
Fig. 2.
Priming of CD4 T cells and IgE responses initiated by alum are reduced in STING−/− mice, and these effects are independent of type I IFNs. (A) STING−/− or WT littermate control mice were immunized with 10 μg of 3K-ova + 200 μg of Alhydrogel in the calf muscle. Before injection, the antigen/adjuvant was mixed with either 5 mg of BSA or DNase I. Popliteal LNs were harvested 7 d after immunization and stained with tetramers and Abs as described in Materials and Methods. Bars on the graph show the mean total number of 3K/IAb tetramer-positive CD44hi CD4 T cells per mouse. Data are combined from two experiments (n = 6 mice per group). (B) STING−/− or WT littermate control mice were immunized with 10 μg of ova (Ova) + alum. Sera were tested for the presence of ova-specific Abs 14 d later. RU, relative units. (C) STING−/− mice were primed and boosted with 10 μg of ova (Ova) + 200 μg of alum, and ova-specific IgE Abs in the sera were analyzed 7 d after the boost by ELISA. Ab data are combined from two separate experiments. Lines on the graphs indicate means, and the error bars indicate SEM. (D) B6 WT mice and IFNAR−/− mice were injected with 10 μg of 3K-ova and 200 μg of Alhydrogel in the calf muscle and compared with naive controls (open bars). Before injection, the antigen/adjuvant was mixed with either 5 mg of BSA (black bars) or DNase I (gray bars). Popliteal LNs were harvested 7 d after immunization and stained with tetramers and Abs as described in Materials and Methods. Bars on graphs show the mean total number of 3K/IAb tetramer-positive CD44hi CD4 T cells per mouse. Data are from a single representative of two experiments (n = 4 mice per group). Statistical differences in A and D were determined using one-way ANOVA with a Bonferroni posttest. Statistical differences in B and C were determined using an unpaired t test. *P < 0.05; **P < 0.01; ***P < 0.001; not significant (ns) indicates P > 0.05 for select comparisons.
Fig. 3.
Fig. 3.
DNase treatment does not impair the number of antigen-loaded cells that accumulate in the draining LN after i.m. injection with alum. (AC) B6 WT mice were injected with nothing (Naive in A, black bar in B), 20 μg of AF647-labeled ova (Ova), or 20 μg of AF647-labeled ova + 200 μg of alum (Ova + alum) in the calf muscles. Before injection, the antigen/adjuvant was mixed with either 5 mg of BSA or DNase. Twenty-four hours after immunization, the draining popliteal LNs were harvested and analyzed by flow cytometry. (A) Percentages of total LN cells positive for ova are shown in representative plots from one representative experiment of three (n = 3 mice per group). (B) Total cells, DCs (CD11chi), and monocytes (CD11cloCD11bhi) were analyzed for their uptake of the labeled ova. Data in B are combined from two separate experiments (n = 6–8 mice per group). The line on the graph represents the background levels of detection determined from untreated control mice (n = 4). (C) B6 WT mice were left untreated (Naive) or were injected with 10 μg of AF647-labeled ova (Ova) alone or combined with 200 μg of alum (Ova + alum) in the calf muscle or peritoneal cavity. Two hours before injection, some mice were treated systemically with the NF-κB inhibitor APD by i.v. injection (gray bars). Twenty-four hours after immunization, the draining LNs were harvested (popliteal after i.m. injection and mediastinal after i.p. injection), processed, and analyzed by flow cytometry. Data are from one representative experiment of two (n = 3 mice per group). (D) Total antigen-positive cells were analyzed for their expression of MHC II and costimulatory molecules. Data (n = 3 mice per group) are from one representative experiment of three. Bars on the graphs indicate mean values (AC) or geometric mean fluorescence intensity (D and E), and error bars indicate SEM. Statistical differences were determined using one-way ANOVA with a Bonferroni posttest. *P < 0.05; **P < 0.01; ***P < 0.001; not significant (ns) indicates P > 0.05 for select comparisons.
Fig. 4.
Fig. 4.
DNase treatment interferes with stable interactions of antigen-specific CD4 T cells with antigen-loaded cells in the draining LN of mice immunized with alum. Tracks were analyzed from multiphoton imaging of polyclonal B6 or antigen-specific OTII CD4 T cells in explanted LNs from mice that were immunized 24 h previously with AF647-labeled ova (Ova) + alum (Alum) and treated with 5 mg of BSA or DNase. Representative movies of data analyzed are shown in Movie S1 (BSA) and Movie S2 (DNase). (A) Plots show the 10-min xy displacement of 20 randomly chosen individual T cells. Only T cells that were tracked for at least 10 min were analyzed. Data are from representative fields from antigen-rich LN regions from two separate experiments. (B) Graphs show MSD of T cells as a function of track duration for polyclonal CD4 T cells and OTII cells in mice immunized with AF-647-labeled ova (Ova) + alum ± BSA or DNase. Only T cells that were tracked for at least 10 min were analyzed. Error bars indicate the SE. Data are from representative antigen-rich fields from two experiments. (C) Graphs show mean displacement and speed of OTII and polyclonal CD4 T cells in explanted LN from mice immunized 24 h previously with AF647-labeled ova (Ova) + alum and treated with 5 mg of BSA or DNase. The data are combined from two separate experiments and include data from two to three time lapses per treatment group in each experiment. A total of 1,037 B6 and 358 OTII cells were analyzed from control mice, and 929 B6 and 228 OTII cells were analyzed from DNase-treated mice. Error bars indicate SEM. The displacement distance for each CD4 T cell was normalized to the number of minutes that each CD4 T cell was followed during the time lapse. Only T cells that were imaged for at least 5 min were analyzed. An unpaired t test was used to test for statistical differences between groups. (D) Maximum interaction time between each T cell and the antigen-loaded cells was analyzed as described in Materials and Methods. Each dot represents the longest interaction with an antigen-bearing cell of an individual T cell in each treatment group. Bars on graphs indicate medians. A one-way Kruskal–Wallace test with Dunn’s multiple comparison test was used to test for statistical difference between groups. The data are combined from two experiments. (E) Distance transformation function (in Imaris software) was used to assign arbitrary units to each OTII cell as a function of distance from antigen, each arbitrary unit was ∼1 μm. These units were used to analyze OTII cells that were in antigen-rich areas (<25 arbitrary units) or areas that were farther from antigen (>25 arbitrary units). Mean OTII cell speed and displacement are shown for each group ± SEM. Data are combined from two experiments. (F) OTII cells that were tracked for at least 10 min were categorized according to whether their longest interaction with antigen was greater than or less than 5 min to estimate the percentage of interactions that were transient in nature or more stable. Differences between proportions were determined using a Fisher’s exact test. Data are combined from four separate experiments. *P < 0.05; **P < 0.01; P < 0.001; not significant (NS) indicates P > 0.05 for select comparisons.
Fig. 5.
Fig. 5.
DNase treatment interferes with stable interactions of antigen-specific CD4 T cells with DCs in the draining LN of mice immunized with alum. Tracks were analyzed from multiphoton imaging of OTII CD4 T cells in explanted LN from mice that were immunized 20 h previously with ova + alum and treated with 5 mg of BSA or DNase. Representative movies of the data analyzed are shown in Movie S3 (BSA) and Movie S4 (DNase). (A) Plots show the 10-min xy displacement in microns of 20 randomly chosen individual T cells. Only T cells that were tracked for at least 10 min were analyzed. Data are representative of two separate experiments. (B) Graph shows MSD of OTII cells as a function of track duration. Error bars indicate the SE. Data are representative of two separate experiments. (C) Graphs show mean track displacement length and speed of OTII cells from mice treated with 5 mg of BSA (black bars) or DNase (gray bars). The data are combined from two separate experiments and include data from two to three time lapses per treatment group in each experiment. Error bars indicate SEM. The displacement distance for each OTII cell was normalized to the number of minutes that each OTII cell was followed during the time lapse. An unpaired t test was used to test for statistical differences between groups. (D) Interactions between T cells and DCs were analyzed as described in Materials and Methods. Each dot represents the longest interaction with a DC of an individual OTII cell in each treatment group for all cells that were tracked for at least 10 min. Bars on graphs indicate medians. A Mann–Whitney nonparametric test was used to test for statistical difference between groups. The data are combined from two experiments in which DC–T-cell interactions could be measured. (E) Distance transformation function (in Imaris software) was used to assign arbitrary units to each OTII cell as a function of distance from a DC. These units (∼1 μm per arbitrary unit) were used to analyze OTII cells that were in DC-rich areas (<25 arbitrary units) or areas that were farther from DCs (>25 arbitrary units). Mean (±SEM) OTII cell speed and displacement are shown for each group. Data are combined from two experiments and include data from three time lapses for each treatment group. (F) OTII cells that were tracked for at least 10 min were categorized according to whether their longest transient in interaction with a DC was greater than or less than 5 min to estimate the percentage of interactions that were transient in nature or were more stable. Differences between proportions were determined using a Fisher’s exact test. Data in F are combined data from two experiments. *P < 0.05; *** P < 0.001; not significant (NS) indicates P > 0.05 for select comparisons.
Fig. 6.
Fig. 6.
Host DNA promotes MHC II-mediated antigen presentation by DCs from alum-immunized mice. DCs were isolated and combined from the popliteal LN of 10 mice per experiment immunized 24 h previously with 3K-ova (△) or ova (OVA) + alum and were treated with either BSA (▪) or DNase (○). These DCs were incubated for 6 h with 508 effector Th1 cells that recognize the 3K peptide/IAb in the presence of BFA and were then stained for intracellular IFN-γ. Data show the ratio of IFN-γ+ cells relative to the positive control (maximum percentage of IFN-γ+ cells after coculture with peptide-pulsed DCs for different DC/CD4 T-cell ratios). Data are combined from three separate experiments. Dots on graph indicate mean ratios, and error bars indicate SEM. Statistical differences for each ratio were determined using one-way ANOVA with a Bonferroni posttest. *P < 0.05; **P < 0.01 for comparisons between the mice treated with BSA and those treated with DNase.

References

    1. Glenny APC, Waddington H, Wallace U. The antigenic value of toxoid precipitated by potassium alum. J Pathol Bacteriol. 1926;29:38–45.
    1. McKee AS, et al. Gr1+IL-4-producing innate cells are induced in response to Th2 stimuli and suppress Th1-dependent antibody responses. Int Immunol. 2008;20(5):659–669. - PMC - PubMed
    1. Grun JL, Maurer PH. Different T helper cell subsets elicited in mice utilizing two different adjuvant vehicles: The role of endogenous interleukin 1 in proliferative responses. Cell Immunol. 1989;121(1):134–145. - PubMed
    1. Brewer JM, et al. Aluminium hydroxide adjuvant initiates strong antigen-specific Th2 responses in the absence of IL-4- or IL-13-mediated signaling. J Immunol. 1999;163(12):6448–6454. - PubMed
    1. McKee AS, et al. Alum induces innate immune responses through macrophage and mast cell sensors, but these sensors are not required for alum to act as an adjuvant for specific immunity. J Immunol. 2009;183(7):4403–4414. - PMC - PubMed

Publication types