

Tales of volcanoes and El-Nino southern oscillations with the oxygen isotope anomaly of sulfate aerosol
- PMID: 23447567
- PMCID: PMC3816482
- DOI: 10.1073/pnas.1213149110
Tales of volcanoes and El-Nino southern oscillations with the oxygen isotope anomaly of sulfate aerosol
Abstract
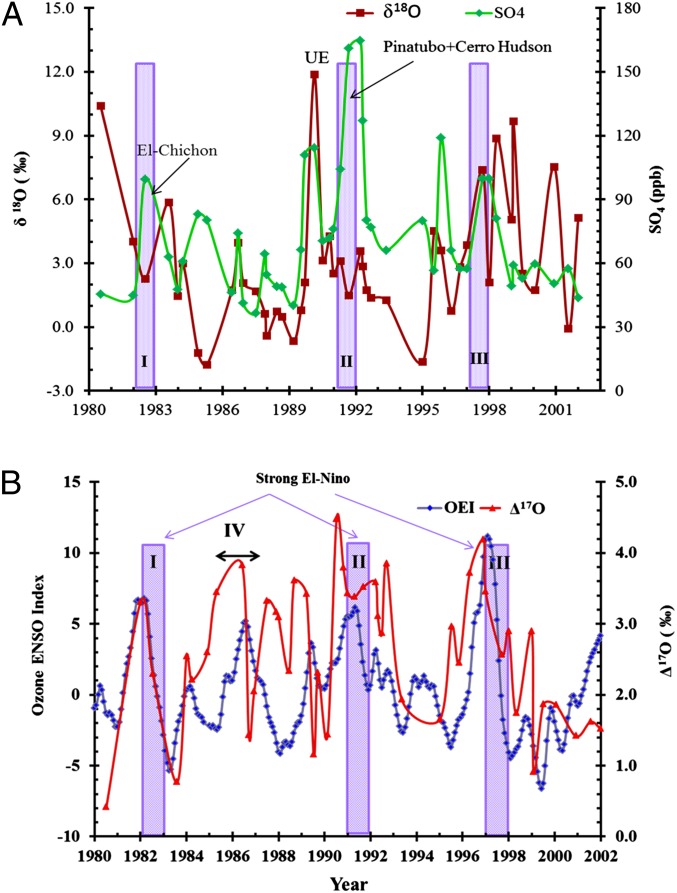
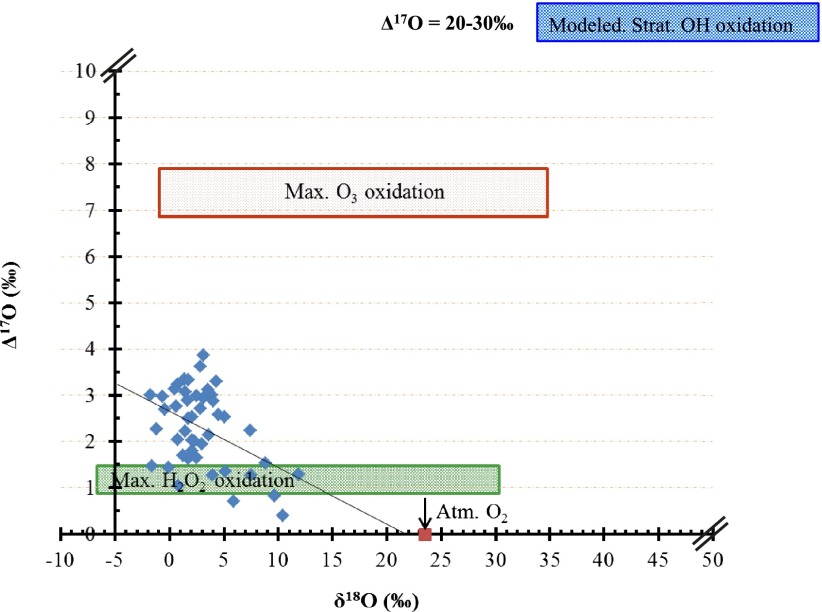
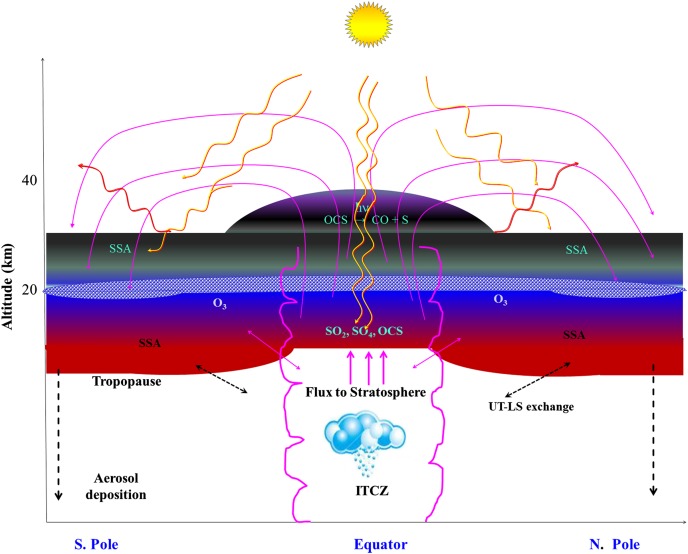
The ability of sulfate aerosols to reflect solar radiation and simultaneously act as cloud condensation nuclei renders them central players in the global climate system. The oxidation of S(IV) compounds and their transport as stable S(VI) in the Earth's system are intricately linked to planetary scale processes, and precise characterization of the overall process requires a detailed understanding of the linkage between climate dynamics and the chemistry leading to the product sulfate. This paper reports a high-resolution, 22-y (1980-2002) record of the oxygen-triple isotopic composition of sulfate (SO4) aerosols retrieved from a snow pit at the South Pole. Observed variation in the O-isotopic anomaly of SO4 aerosol is linked to the ozone variation in the tropical upper troposphere/lower stratosphere via the Ozone El-Niño Southern Oscillations (ENSO) Index (OEI). Higher (17)O values (3.3‰, 4.5‰, and 4.2‰) were observed during the three largest ENSO events of the past 2 decades. Volcanic events inject significant quantities of SO4 aerosol into the stratosphere, which are known to affect ENSO strength by modulating stratospheric ozone levels (OEI = 6 and (17)O = 3.3‰, OEI = 11 and (17)O = 4.5‰) and normal oxidative pathways. Our high-resolution data indicated that (17)O of sulfate aerosols can record extreme phases of naturally occurring climate cycles, such as ENSOs, which couple variations in the ozone levels in the atmosphere and the hydrosphere via temperature driven changes in relative humidity levels. A longer term, higher resolution oxygen-triple isotope analysis of sulfate aerosols from ice cores, encompassing more ENSO periods, is required to reconstruct paleo-ENSO events and paleotropical ozone variations.
Keywords: Cerro Hudson; El-Chichón; Intertropical Convergence Zone; Pinatubo.
Conflict of interest statement
The authors declare no conflict of interest.
Figures

References
-
- Jones A, Haywood J, Boucher O. A comparison of the climate impacts of geoengineering by stratospheric SO2 injection and by brightening of marine stratocumulus cloud. Atmos Sci Lett. 2011;12(2):176–183.
-
- Jones A, Haywood J, Boucher O, Kravitz B, Robock A. Geoengineering by stratospheric SO2 injection: Results from the Met Office HadGEM(2) climate model and comparison with the Goddard Institute for Space Studies ModelE. Atmos Chem Phys. 2010;10(13):5999–6006.
-
- Leibensperger EM, et al. Climatic effects of 1950-2050 changes in US anthropogenic aerosols—Part 1: Aerosol trends and radiative forcing. Atmos Chem Phys. 2012;12(7):3333–3348.
-
- Soloman SQD, Manning M. Intergovernmental Panel on Climate Change Fourth Assessment Report, Climate Change 2007: The Physical Science Basis. New York: Cambridge Univ Press; 2007.
-
- Deshler T. A review of global stratospheric aerosol: Measurements, importance, life cycle, and local stratospheric aerosol. Atmos Res. 2008;90(2-4):223–232.
Publication types
MeSH terms
Substances
LinkOut - more resources
Full Text Sources
Other Literature Sources
Medical
Miscellaneous
