. 2013 Feb 27;33(9):3834-43.
doi: 10.1523/JNEUROSCI.3689-12.2013.

Identification of nonvisual photomotor response cells in the vertebrate hindbrain

Affiliations

Identification of nonvisual photomotor response cells in the vertebrate hindbrain

David Kokel et al. J Neurosci. .

Abstract

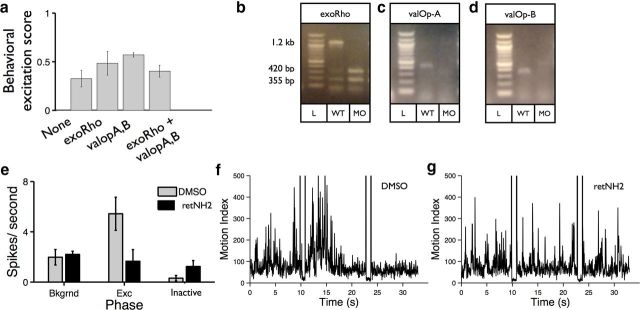
Nonvisual photosensation enables animals to sense light without sight. However, the cellular and molecular mechanisms of nonvisual photobehaviors are poorly understood, especially in vertebrate animals. Here, we describe the photomotor response (PMR), a robust and reproducible series of motor behaviors in zebrafish that is elicited by visual wavelengths of light but does not require the eyes, pineal gland, or other canonical deep-brain photoreceptive organs. Unlike the relatively slow effects of canonical nonvisual pathways, motor circuits are strongly and quickly (seconds) recruited during the PMR behavior. We find that the hindbrain is both necessary and sufficient to drive these behaviors. Using in vivo calcium imaging, we identify a discrete set of neurons within the hindbrain whose responses to light mirror the PMR behavior. Pharmacological inhibition of the visual cycle blocks PMR behaviors, suggesting that opsin-based photoreceptors control this behavior. These data represent the first known light-sensing circuit in the vertebrate hindbrain.


Figures

Figure 1.
Figure 1.
Light stimuli elicit stereotyped photomotor behaviors in zebrafish embryos. Plots showing the combined motor activity of 10 dark-adapted zebrafish embryos in response to one (a) or two (b) light stimuli (red bars). c, Plot showing the motor activity of an individual zebrafish during the PMR assay. High-magnitude, low-frequency peaks represent coiling events (●), whereas low-magnitude, high-frequency peaks represent swim events (gray bar). Paired vertical lines at 10 and 23 s are stimulus artifacts that indicate the start and end of each 1 s stimulus. d, Image showing the motor activity matrix of 479 individual animals. Matrix rows represent individual animals, and columns represent time. Arrowheads indicate the timing of two 1 s stimuli. e, Smoothed histograms showing the probability of coiling (black) and swimming (gray) events for 479 individual animals during the PMR assay. f, Bar plot showing the percentage of animals exhibiting coiling and swimming behaviors (y-axis) during the indicated PMR phase (x-axis). The differences between the percentages of animals coiling during each phase are significant: p < 0.001. The percentage of animals swimming during the excitation phase is significantly more than during the background and refractory phases: p < 0.001.
Figure 2.
Figure 2.
Motor circuits are strongly recruited during PMR excitation. Muscle cells were recorded in paralyzed embryos to assay fictive motor output. A, Top diagram, The experimental procedure. The lines below show representative traces that begin upon stimulus triggering. Embryos are photostimulated at the beginning of the experiment (PS0), followed by 10 min of dark adaptation with occasional spontaneous events (SE); at the 11th minute, the embryos receive a tactile stimulus (TS1), followed by a photostimulus (PS1), another tactile stimulus (TS2), and a final photostimulus (PS2). B, Latency graph for tail and head tactile stimuli and photo stimuli (PS). There is a 100-fold change in the gray axis. C, Box-plot showing event duration for spontaneous, tactile, and photo stimuli-evoked events. D, Percentage of events exhibiting large struggling coils in spontaneous, tactile, and photo-evoked events. The numbers in parentheses represent the total number of motor events analyzed.
Figure 3.
Figure 3.
The PMR is a nonvisual photic behavior. a, Line plot showing behavioral excitation scores of animals tested at the indicated developmental ages (n = 10 wells). b, The bar plot quantifies average coils per second in 27 hpf animals before (pre) and after (post) stimulation (n = 9 animals per group). The difference between prestimulation and poststimulation in light-treated animals is significant: *p < 0.01. Inset, An example plot of reduced motor activity after stimulation in a 27 hpf animal. c, Top, Images showing example preparations. Preparation I is an intact animal. Solid, hyphenated, and dotted lines indicate the locations of transections. Preparation II lacks all forebrain and midbrain structures but retains the posterior hindbrain. Preparation III lacks all supraspinal input but remains touch sensitive. Preparation IV lacks a portion of the tail. Bar plot showing behavioral excitation scores for the indicated preparations (n = 5 wells). Preparation III is significantly different from all other preparations: p > 0.001. Reduced excitation score in tailless fish (preparation IV) is the result of fewer moving pixels in these truncated animals. d, Top, Drawing of 30 hpf zebrafish embryo showing stimulus locations (red boxes). Bottom, Bar plot showing the behavioral excitation scores of animals stimulated at the indicated locations (n = 3 animals, each animal stimulated in every condition). The difference between the group receiving hindbrain stimulation all other groups is significant: p < 0.001. Data are mean ± SD.
Figure 4.
Figure 4.
The PMR is a response to visible light. a, Bar plot showing behavioral excitation scores in response to white light stimuli (1 s) at the indicated intensity (n = 10). The difference between the groups treated with 1 and 13 μW/mm2 is significant: p < 0.001. Significantly more activity is elicited by 33 μW/mm2 than 13 μW/mm2: p < 0.005. “1, 67” indicates that these animals were preexposed to low levels of ambient light (1 μW/mm2) for 10 min before PMR analysis with a 67 μW/mm2 stimulus. b, Table showing the effects of stimuli at the indicated wavelengths and intensities. + indicates stimuli that trigger PMR excitation; and −, stimuli that did not trigger PMR excitation. c, Bar plot showing behavioral excitation scores in response to white light stimuli for the indicated stimulus duration (n = 5). An ANOVA showed that the differences between groups exposed to ≤0.5 s are not statistically significant. There is a statistically significant difference between the 0.5 s treatment group and the 1, 10, and 20 s treatment groups: p < 0.05. The difference between 0.7 and 10 s is also significant: p < 0.05. d, Bar plot showing the duration of behavioral excitation in response to stimuli of the indicated duration (n = 5). The difference between the 0.1 and 20 s treatment groups is significant: p < 0.001. Data are mean ± SD.
Figure 5.
Figure 5.
A discrete set of neurons is activated during the PMR. a, Left, 3D projection of a typical 36 hpf embryonic zebrafish brain expressing GCaMP2 under the pan-neuronal HuC promoter. The orange outline indicates the anatomical border of the embryo. Right, Thirteen representative optical slices separated by 3 μm in the hindbrain region outlined in red. Neuronal responses to blue light stimulation (bars) are shown beside each slice. Red traces show the change in average fluorescence for the entire slice, and black traces show the smoothed change in fluorescence averaged across all active regions in the slice. b, Activated neurons (green) and corresponding smoothed fluorescence changes from a single slice in the same embryo as in a. Traces 1 and 2 (red) show representative neuropil responses from the regions outlined by the hyphenated red lines. The image in b corresponds to the plane labeled with “*” in a. c, Boxplots showing the distribution of hindbrain neuronal response latencies, durations, and amplitudes during the PMR. (n = 318–328 ROIs, 7 embryos). d, Mean detected neuronal ROI densities (ROIs/1000 μm3, white) and response amplitudes (black) in the hindbrain (HB, 369 ROIs, 132 volumes) and forebrain (FB, 56 ROIs, 153 volumes) of three 36 hpf embryos. The same quantities are plotted for the hindbrain during trials without stimulus presentation (HB-NS, 11 ROIs, 132 volumes). Error bars indicate SEM. **p < 0.001 (Student's t test). e, Top left, Normalized spatial distribution of detected ROIs (n = 273, green) from 4 fish overlaid on an average intensity projection of the hindbrain in a typical side-mounted 36 hpf HuC::GCamP2 fish. Bottom left, The same spatial distribution of neurons as viewed from a top-down image reslice. f, Top right, orange, Histogram quantifying the spatial distribution of identified ROIs along the D-V axis. Top left, cyan, Histogram quantification of M-L axis. Bottom, blue, R-C axis. Solid lines in e represent the axes used to construct corresponding histograms in f. Arrows indicate the starting positions along each axis used for histogram construction. Dotted white lines indicate the hindbrain-spinal cord boundary. For reference, the dotted red line in e delineates the rostral extent of the image in b.
Figure 6.
Figure 6.
Opsin phototransduction is necessary for photomotor excitation. a, Bar plot showing behavioral excitation scores of uninjected controls (None), and animals injected with morpholinos targeting exorhodopsin (exRho), valopsin A, and valopsin B (valopA,B), and the three opsins together (exoRho + valopA,B) (n = 5 wells, 10 animals per well). Morphant scores are not significantly less than the controls. b–d, Gel images showing the efficacy of the splice blocking morpholinos tested in a. e, Bar plot showing number of motion index spikes per second of animals treated with DMSO, or the opsin inhibitor retNH2 (n = 5). For DMSO-treated control animals, spike rate is significantly greater during the excitation phase (Exc) and significantly lower during the inactive phase (Inactive) compared with background (Bkgrnd). p < 0.01. For retNH2-treated animals, spike rate is not significantly different during any of the phases. Examples from animals treated with DMSO (f), or retNH2 (g) are shown.

References

    1. Ahrens MB, Li JM, Orger MB, Robson DN, Schier AF, Engert F, Portugues R. Brain-wide neuronal dynamics during motor adaptation in zebrafish. Nature. 2012;485:471–477. - PMC - PubMed
    1. Asaoka Y, Mano H, Kojima D, Fukada Y. Pineal expression-promoting element (PIPE), a cis-acting element, directs pineal-specific gene expression in zebrafish. Proc Natl Acad Sci U S A. 2002;99:15456–15461. - PMC - PubMed
    1. Becker HE, Cone RA. Light-stimulated electrical responses from skin. Science. 1966;154:1051–1053. - PubMed
    1. Berson DM, Dunn FA, Takao M. Phototransduction by retinal ganglion cells that set the circadian clock. Science. 2002;295:1070–1073. - PubMed
    1. Best JD, Berghmans S, Hunt JJ, Clarke SC, Fleming A, Goldsmith P, Roach AG. Non-associative learning in larval zebrafish. Neuropsychopharmacology. 2008;33:1206–1215. - PubMed

Publication types

MeSH terms

LinkOut - more resources