. 2013 Feb 27;33(9):4076-93.
doi: 10.1523/JNEUROSCI.1659-12.2013.

Simultaneous top-down modulation of the primary somatosensory cortex and thalamic nuclei during active tactile discrimination

Affiliations

Simultaneous top-down modulation of the primary somatosensory cortex and thalamic nuclei during active tactile discrimination

Miguel Pais-Vieira et al. J Neurosci. .

Abstract

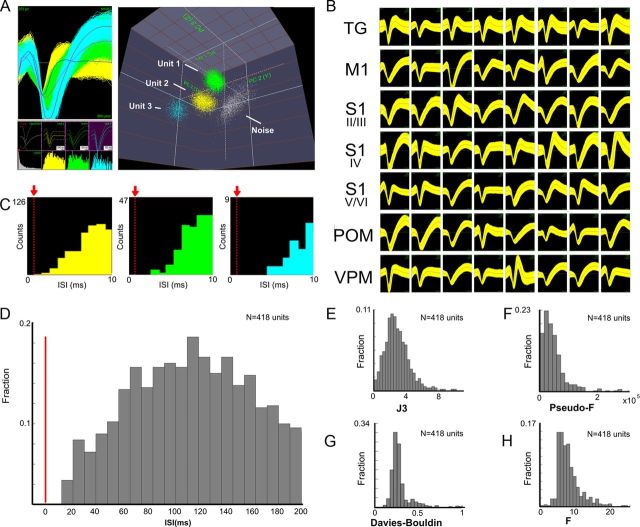
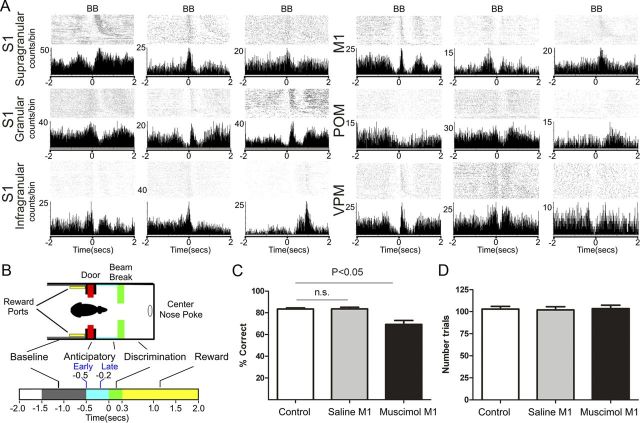
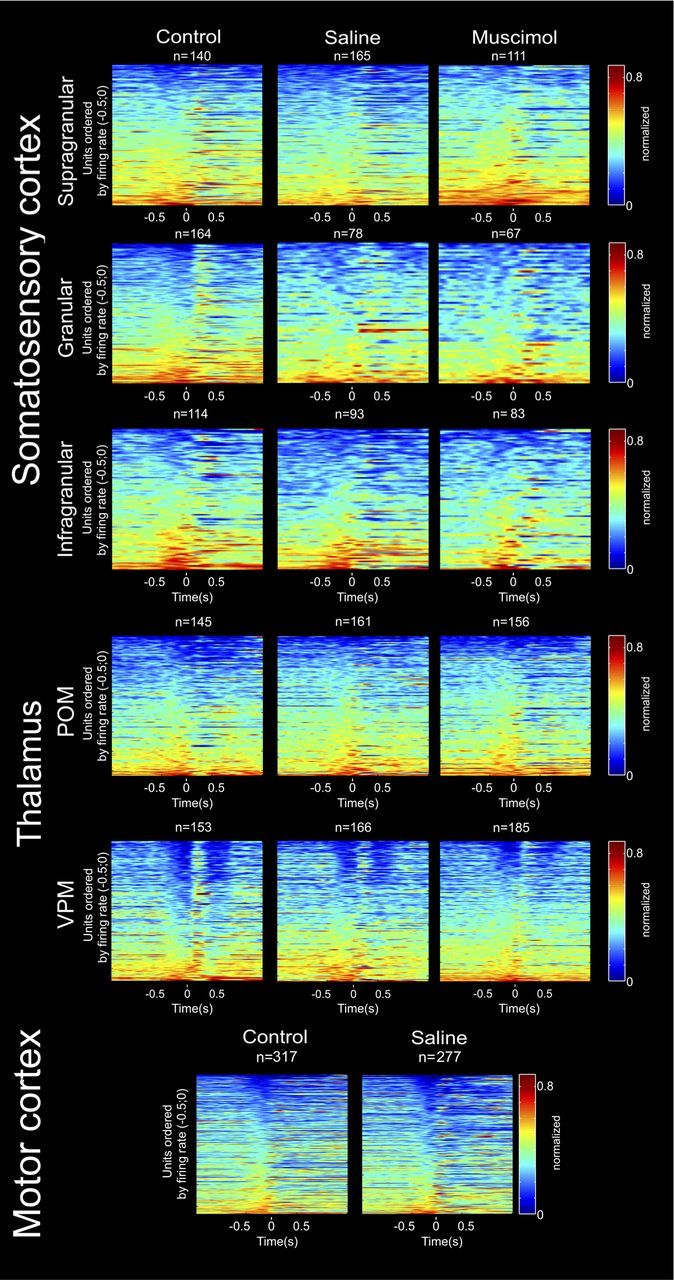
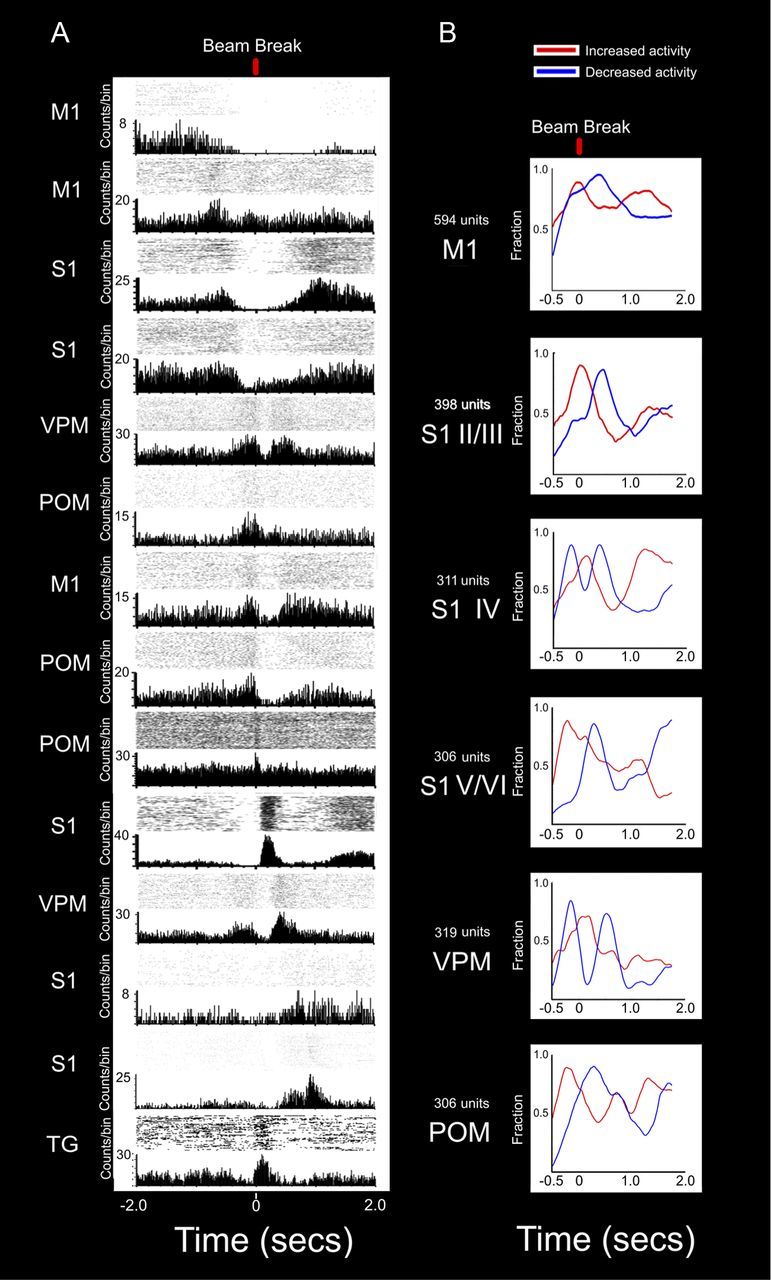
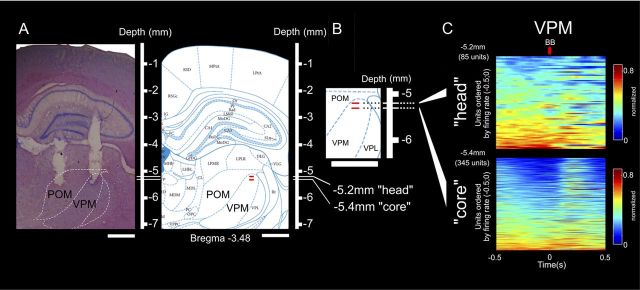
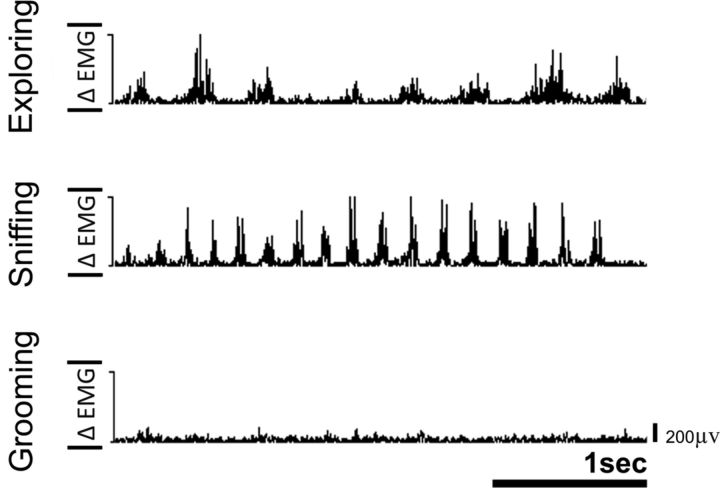
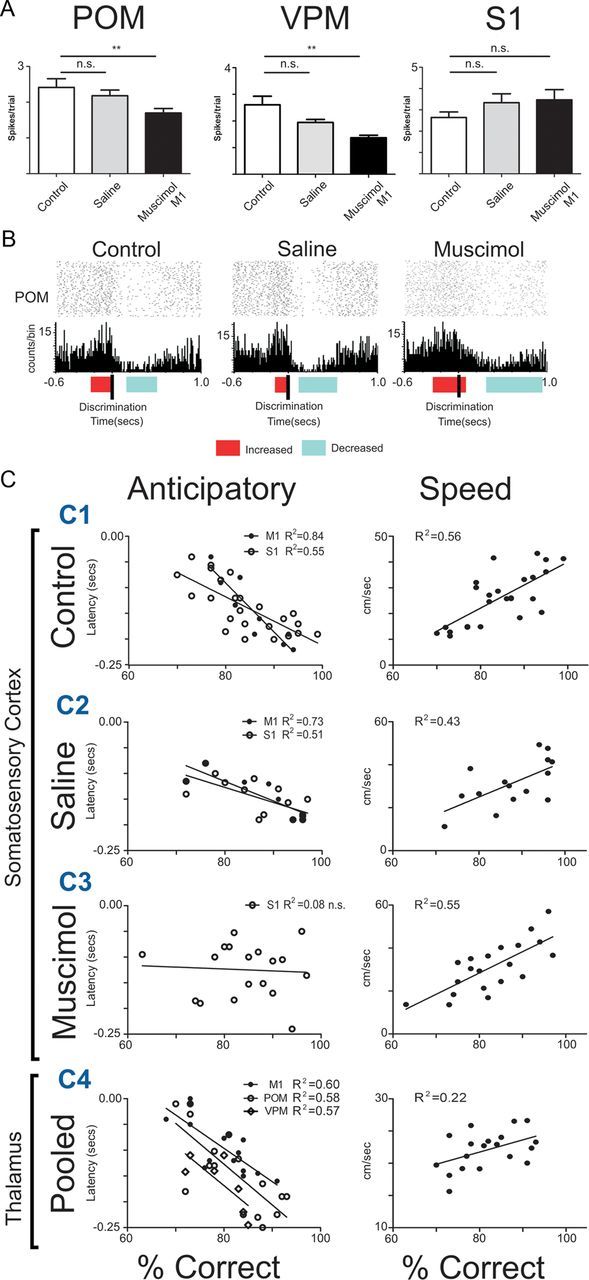
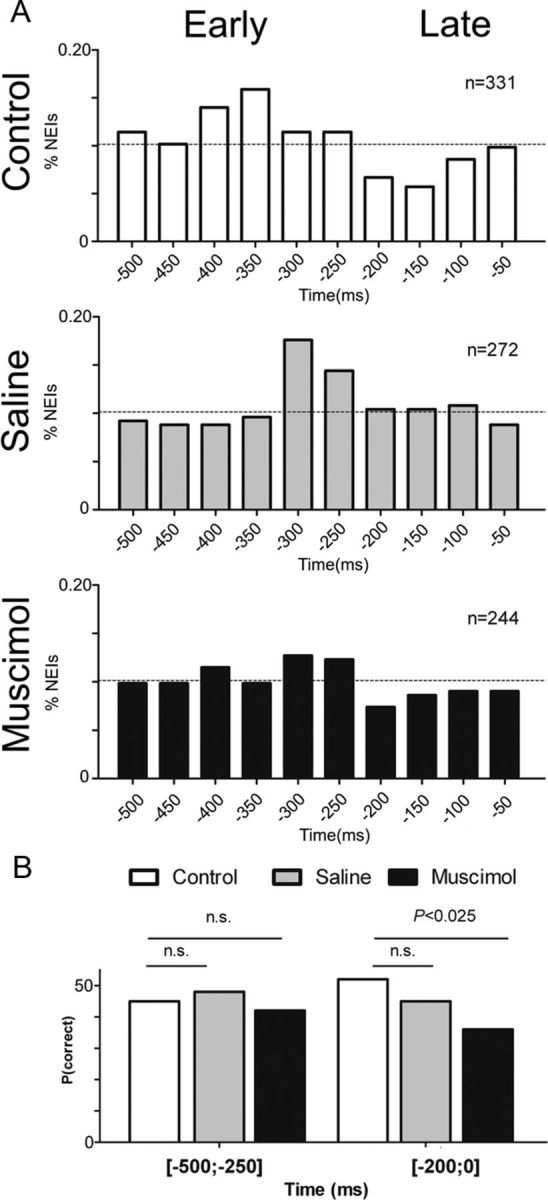
The rat somatosensory system contains multiple thalamocortical loops (TCLs) that altogether process, in fundamentally different ways, tactile stimuli delivered passively or actively sampled. To elucidate potential top-down mechanisms that govern TCL processing in awake, behaving animals, we simultaneously recorded neuronal ensemble activity across multiple cortical and thalamic areas while rats performed an active aperture discrimination task. Single neurons located in the primary somatosensory cortex (S1), the ventroposterior medial, and the posterior medial thalamic nuclei of the trigeminal somatosensory pathways exhibited prominent anticipatory firing modulations before the whiskers touching the aperture edges. This cortical and thalamic anticipatory firing could not be explained by whisker movements or whisker stimulation, because neither trigeminal ganglion sensory-evoked responses nor EMG activity were detected during the same period. Both thalamic and S1 anticipatory activity were predictive of the animal's discrimination accuracy. Inactivation of the primary motor cortex (M1) with muscimol affected anticipatory patterns in S1 and the thalamus, and impaired the ability to predict the animal's performance accuracy based on thalamocortical anticipatory activity. These findings suggest that neural processing in TCLs is launched in anticipation of whisker contact with objects, depends on top-down effects generated in part by M1 activity, and cannot be explained by the classical feedforward model of the rat trigeminal system.


Figures

Figure 1.
Figure 1.
Cluster separation and waveform quality in recordings. A, Typical examples of single unit waveforms and cluster separation (3D) recorded. B, Examples of waveforms from single units recorded in all regions studied. C, ISIs of Units 1–3 presented in A. The red arrows indicate the refractory period. Note the absence of spike counts in the refractory period. D, Distribution of average ISIs for single units recorded in all control sessions. E–H, Distributions of single unit statistics for all control sessions.
Figure 2.
Figure 2.
Anticipatory activity across the multiple thalamocortical loops of the rat trigeminal system. A, Examples of single unit responses recorded across the thalamocortical loops as seen in PSTHs centered around the beam break (time 0) around which whiskers make contact with the aperture edges. Notice that periods of increased or decreased anticipatory firing activity occur frequently before the whiskers make contact with the tactile stimulus (0 s). All cortical areas (S1 and M1) and thalamic nuclei (VPM and POM) exhibit such anticipatory firing. B, The top shows a schematic of the behavioral chamber, whereas the bottom utilizes different colors to indicate the different epochs of the behavioral task. All times are referenced to the BB in the discrimination bars (0 s). A trial starts at −2 s. Note that baseline activity is coincident with the period before the rat crosses the door (in red) that separates the outer and inner chambers. The anticipatory period corresponds to the epoch before the whiskers make contact with the discrimination bars (light blue). The discrimination period includes the time after the beam break and center nose poke (green). The reward period includes the time between the center nose poke, the decision, and the reward port nose poke (yellow). Anticipatory analysis includes an early (from −0.5 to −0.2 s) and a late period (from −0.2 to 0 s). These two periods were determined based on the distribution of neural responses (for details, see Materials and Methods). C, Percentage of correct discrimination trials in control or after saline or muscimol injections in M1. D, Number of trials performed in each condition. Although M1 inactivation impaired tactile discrimination, the number of trials performed or speed of performance were not affected, suggesting that no gross motor impairments were present. Error bars indicate SEM.
Figure 3.
Figure 3.
Neural ensemble activity across multiple thalamocortical loops during active tactile discrimination. Each row in each panel represents the activity of a single unit, normalized to its maximum firing rate, during a session. Each panel represents the activity of a different structure (from top to bottom: S1 supragranular layers, S1 granular layer, S1 infragranular layers, POM, VPM, and M1). Each column represents a different experimental condition (from left to right: control, saline injection in M1, and muscimol injection in M1). Each of the different colors represents a variation in the firing rate with red indicating excitation and deep blue indicating inhibition. Time 0 corresponds to the discrimination bar beam break. Units were ordered by the maximum firing rate in −0.5 to 0 s. In all panels, the bottom rows of cells presented increased firing rates immediately before the whiskers contacted with the discriminanda (time 0). These patterns were region specific, and the patterns of increased activity in a group of units were accompanied by a symmetrical pattern of decreased activity in another group, both in the same and in different regions. For example, notice that neurons in VPM and S1 granular layer presented marked anticipatory inhibitory firing, which was immediately followed by a firing increase after the whiskers contacted bars. A symmetrical pattern of increased anticipatory activity followed by inhibition is present in S1 infragranular layers and POM.
Figure 4.
Figure 4.
Ranking of neuronal ensembles reveals extensive anticipatory firing activity in M1, S1, VPM, and POM. A, PSTHs of all areas studied showing different periods of increased or decreased activity spanning across the whole length of a trial. Time 0 corresponds to the discrimination bar beam break. Cells presented are not from the same animal. The top cell was recorded in M1 and presented a period of increased activity only before the trial started. As soon as the door opened, this cell decreased its activity. The onset of this decreased activity matched the beginning of firing increases observed in other M1 and in S1 neurons (second to fourth rows). This suggests an initial role for M1 at the preparatory stages of a trial, followed by a second class of cells both in M1 and S1 related to early anticipatory activity as the door opens (approximately −0.5 s). As the animal moved from the door to the discrimination bars, anticipatory cells in VPM, POM, and M1 (fifth through eighth rows) exhibited a sharp increase in activity that ended as the whiskers contacted the bars (time 0). Although not shown in this figure, cells with anticipatory increases of firing rate were present in all structures recorded. As this group of anticipatory cells decreased its activity, a different group of cells in POM, M1, and S1 (9th through 11th rows) presented an increase in activity. This period coincides with the whiskers sampling the discrimination bars. Also, as the whiskers touch the center nose poke and the rat chooses one of the reward ports (12th and 13th rows), firing increases were observed both in VPM and S1. Notice that after the whiskers had sampled the discrimination bars, increases of activity started to appear again in some of the upper rows neurons, suggesting that their activity was temporarily inhibited during tactile discrimination. On the bottom row, the activity of a typical TG neuron is presented. Between the door and the discrimination bars (∼250 ms), there is almost no activity in this neuron, indicating that no whisker contacts or movements were made. A clear increase in TG activity is observed as the whiskers make contact with the tactile discriminanda. Overall, the combined PSTHs presented here show that active tactile discrimination results from complex interactions where all regions are likely to have a significant contribution at every point in time, and not just during a specific epoch (e.g., motor or tactile periods). B, Each line represents the fraction of neuronal firing modulations that showed increased or decreased activity at each moment during the trial. Neuronal activity from all recorded structures is aligned to show how different areas present different patterns of increased and decreased activity during a trial. The top panel shows that at the beginning of the trial, M1 starts with a marked period of increased activity (red trace), which contains the largest and earliest fraction of significant responses in all regions. These significant increases of activity end at the moment the whiskers contact the discrimination bars, after which a period of decreased in firing activity follows. A similar pattern of increased anticipatory activity, followed by a marked decrease during the discrimination phase, was also present in S1 layers V/VI and in POM (fourth and sixth rows, respectively). In VPM and S1 layer IV, a very distinct sequence of decrease–increase–decrease in firing activity was observed. The initial decrease in firing coincides with the period of increased anticipatory activity observed in M1, S1 layers V/VI, and POM, suggesting that the motor cortex could be gating these S1 and VPM neurons. Conversely, the period of maximum firing increase is present immediately after the whiskers sample the discrimination bars, marking the arrival of peripheral tactile related information. Last, layers II/III of S1 present a firing increase centered at the moment of the discrimination bar beam break, which is followed by a marked decrease of activity. This unique pattern of activity suggests that layers II/III could be fundamental for the integration of anticipatory and tactile information during the bars sampling period.
Figure 5.
Figure 5.
Both head and core of barreloids in VPM present anticipatory neural activity. A, Histological verification (left) and comparison with standard diagrams (right) (Paxinos and Watson, 1998) of microelectrode placement in the POM and VPM. The white lines in the rulers and the two red markings indicate the depths at which neural activity corresponding to the head (−5.2 mm) and core (−5.4 mm) regions of the VPM was recorded. B, Magnification of standard diagram showing the depths used to define head and core of the barreloids. C, Top and bottom show the neural ensemble activity recorded from depths corresponding to head and core of the barreloids. Each row in each panel represents the activity of a single unit during a session normalized to its maximum firing rate. Each of the different colors represents a significant variation in the firing rate, with red indicating excitation, and deep blue indicating inhibition. Time 0 corresponds to the discrimination bars BB. Units were ordered by the maximum firing rate in −0.5 to 0 s. In both the head and core of the VPM, the bottom rows of neurons exhibited increased anticipatory firing rates immediately before the whiskers contacted with the discriminanda (time 0). This pattern of anticipatory increased activity was more pronounced in the head of the barreloids than in the core. In the core of the VPM, the period of anticipatory activity was mainly characterized by a strong inhibition before and after the whiskers sampled the aperture bars. During the discrimination period, a marked increase in firing activity was present in the core of the VPM. A similar increase was not as evident in the head of the VPM. These results show that anticipatory firing could be found at all depths studied in the VPM, but that each of the two different compartments of this thalamic nucleus displayed a very specific pattern of firing modulation. In the head of the VPM, the pattern of activation was closer to the one described for M1, POM, and S1 infragranular layers, while in the core of the VPM, the pattern was closer to the one observed in granular layer of S1. VPL, Ventral posterior lateral thalamic nucleus.
Figure 6.
Figure 6.
Trigeminal ganglion activity is phase locked to the tactile stimulus contact and does not appear during the anticipatory firing period. A, Example of trigeminal ganglion PSTHs during active aperture discrimination. The panels show PSTHs (10 ms bins), with respect to the aperture bar beam break (time = 0), of trigeminal ganglion single unit and multiunits recorded during the tactile discrimination task. Between the door (blue) and the beam break (red), there is an overall reduction or absence of activity in the TG neurons, indicating that no whisker movements or contacts are present during this period. B, Each row in the panel represents the activity of a single unit or multiunit, normalized to its maximum firing rate, during a session. Each of the different colors represents a variation in the firing rate, with red indicating excitation, and deep blue indicating inhibition. Time 0 corresponds to the discrimination bar beam break. Units were ordered by the maximum firing rate in 0 to 0.25 s. A total of 736 units and multiunits recorded from five rats in 28 sessions are presented. The periods of increased activity reflect whisker contacts with the door, discrimination bars and center nose poke. A marked decrease in TG firing rate is observed in the period −0.25 to 0 s between the door and the discrimination bars. C, The activity levels presented for TG, VPM, and S1 were recorded simultaneously (n = 3 rats). Between the door and the discrimination bars (from −250 to 0 ms), both VPM and S1 presented a significant group of cells with increased activity. In the trigeminal ganglion, this activity was almost absent (for details, see Results). Comparison of the fraction of significant increased responses (red lines in right column) showed that both VPM and S1 presented anticipatory increases in activity that did not match the TG increase. However, immediately after the beam break, all three regions presented a simultaneous peak of increased activity. D, Each column demonstrates PSTHs of neurons recorded from the same session in three different animals. While the TG presented a marked reduction of activity in the 250 ms before the BB, sustained or phasic increases in the VPM and S1 could still be observed. The presence of S1 and VPM modulations in the absence of TG activity indicate that the origin of anticipatory activity cannot be due to the activation of primary whisker afferents from the TG.
Figure 7.
Figure 7.
Examples of rectified EMG activity recorded from a rat with bilateral facial nerve lesion in an open field during three typical behaviors. After bilateral facial nerve lesion, rats learned that sniffing or chewing allowed them to make small whisker movements. Analysis of EMG peak activity allowed detection of such movements. The frequencies of the EMG events correspond to the following behaviors in open field: exploring (∼4 Hz), sniffing/twitching (7–12 Hz), and grooming. None of this EMG activity was present during anticipatory period (see Results).
Figure 8.
Figure 8.
Anticipatory activity is independent of EMG events. A, Examples of four different trials in which increased anticipatory neuronal activity in a POM neuron did not match small EMG events. The top of each trial shows the raster plot for the POM neuron. Below the raster, a PSTH represents the number of counts per bin (smoothed with a Gaussian window of 30 ms) of the same cell. On the bottom, the rectified EMG activity is displayed together with red triangles showing EMG events (defined as 3 SDs above the overall activity of the session). Since this rat underwent bilateral facial nerve sections, the anticipatory firing increases shown by this POM neuron cannot be explained by the typical whisker positioning used by animals to perform this task. After removing the trials where EMG events were present, the anticipatory activity of this cell was still highly significant. The same was true for 80% of POM and VPM neurons displaying anticipatory firing before the beam crossing. B, Average normalized (to a maximum of 1) EMG activity recorded from the three rats around the beam break and around the EMG events. No significant increase in EMG activity was observed before the beam break, indicating that EMG events were mostly absent during the period of anticipatory firing observed in the S1, VPM, and POM during execution of this task. C, Anticipatory activity and EMG event-related activity occur in different groups of cells. Activity of three neurons relative to beam break (left) and to EMG events is shown. The top neuron presented significant increased anticipatory activity for the beam break, but not for the EMG events, suggesting that anticipatory activity was independent of the EMG signal. The middle neuron showed a small increase of activity immediately after the beam break, but no clear changes around the EMG events. In contrast, notice that the bottom neuron is phase locked to the EMG events, but not to the tactile discrimination task. The differences found in neurons that presented EMG-related or anticipatory activity suggest that fundamentally different classes of neurons were activated around EMG events or during the anticipatory period.
Figure 9.
Figure 9.
Timing of anticipatory firing activity predicts animal's performance. A, The inactivation of M1 with muscimol reduced the magnitude of anticipatory responses in VPM and POM, but not in S1. However, the proportion of cells that presented anticipatory firing increased in S1 (for details, see Results). B, Examples of an anticipatory unit recorded from POM in the same channel for 3 consecutive days, presenting similar wave shape, ISI, and average firing rate. The colored horizontal bars indicate the beginning and end of significant increases (red) and decreases (blue) in activity. This POM unit presented a similar profile of multiphasic response in all three sessions. This profile consisted of anticipatory increased activity that ended when the whiskers made contact with the tactile stimulus, followed by a period of decreased activity. After M1 inactivation, the exact timing of the anticipatory response offset was altered, suggesting that the motor cortex is involved in shaping fine details of neural anticipatory responses. C, Anticipatory activity and animal's speed as a predictor of animal's performance. The latency of the anticipatory activity onset recorded in the thalamocortical loops during control and saline sessions was a good predictor of the animal's performance in the tactile discrimination task. The earlier the onset of anticipatory activity, the better the animal's performance. Animal speed was also a very good predictor of animal's performance. The faster the animal, the better its performance (top right). After M1 inactivation, anticipatory activity no longer contained enough information to predict animal's performance. However, animal's speed remained a good predictor of tactile performance. Anticipatory onsets from VPM and POM are from control and saline sessions pooled together, since a smaller number of sessions were recorded in these conditions. Error bars indicate SEM. **p < 0.01.
Figure 10.
Figure 10.
Trial-by-trial ensemble analysis of anticipatory neural activity. An NEI was defined as the first significant (p ≤ 0.05) neural ensemble firing modulation in the anticipatory period −500 to −50 ms relative to the trial baseline period. A, The distribution of NEIs in the anticipatory period of control and saline ensembles was concentrated around the period −400 to −200 ms. After M1 inactivation the distribution of anticipatory NEIs was closer to a uniform distribution, suggesting that M1 modulation is associated with the presence of NEIs in the early anticipatory period. B, The panel shows the proportion of correct trials occurring after an early −500 to −250 ms or late −200 to 0 ms NEI. The presence of an NEI during the early anticipatory period was associated with a similar proportion of correct aperture discriminations in control, saline, and muscimol conditions (interval −500 to 250 ms; left). However, the presence of an NEI in the late anticipatory period was associated with a significantly smaller proportion of correct trials after muscimol infusion, when compared to control or saline conditions (interval −200 to 0 ms; right). This result indicates that M1 directly affects NEIs in the late anticipatory period, leading to incorrect discrimination trials.

Comment in

Similar articles

Cited by

References

    1. Arkley K, Grant R, Mitchinson B, Prescott T. The relationship between whisking and locomotion in rats. Soc Neurosci Abstr. 2011;37:76.24.
    1. Armstrong-James M, Fox K. Spatiotemporal convergence and divergence in the rat S1 “barrel” cortex. J Comp Neurol. 1987;263:265–281. - PubMed
    1. Belford GR, Killackey HP. Vibrissae representation in subcortical trigeminal centers of the neonatal rat. J Comp Neurol. 1979;183:305–321. - PubMed
    1. Brecht M, Schneider M, Sakmann B, Margrie TW. Whisker movements evoked by stimulation of single pyramidal cells in rat motor cortex. Nature. 2004;427:704–710. - PubMed
    1. Chapin JK, Woodward DJ. Modulation of sensory responsiveness of single somatosensory cortical cells during movement and arousal behaviors. Exp Neurol. 1981;72:164–178. - PubMed

Publication types

MeSH terms

LinkOut - more resources