. 2013 Feb 27;33(9):4094-104.
doi: 10.1523/JNEUROSCI.4825-12.2013.

Altered synaptic dynamics during normal brain aging

Affiliations

Altered synaptic dynamics during normal brain aging

Ricardo Mostany et al. J Neurosci. .

Abstract

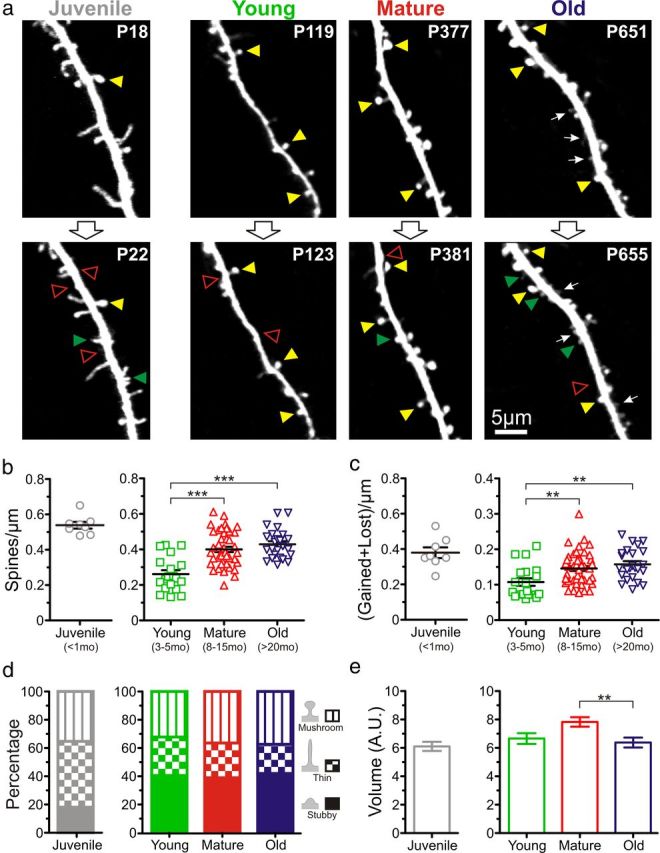
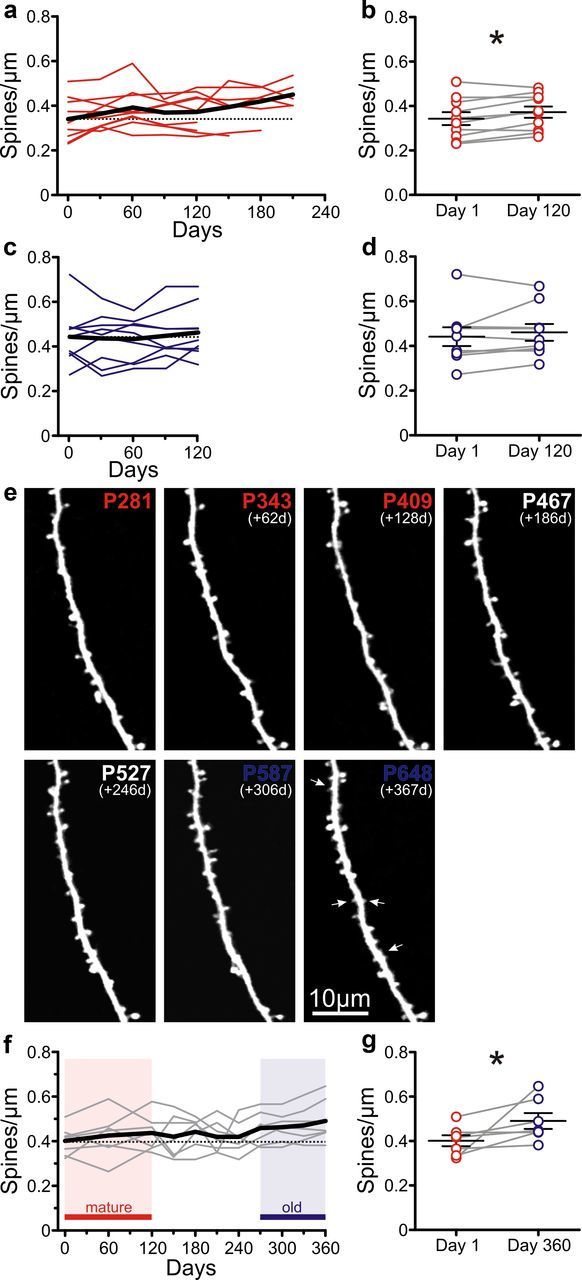
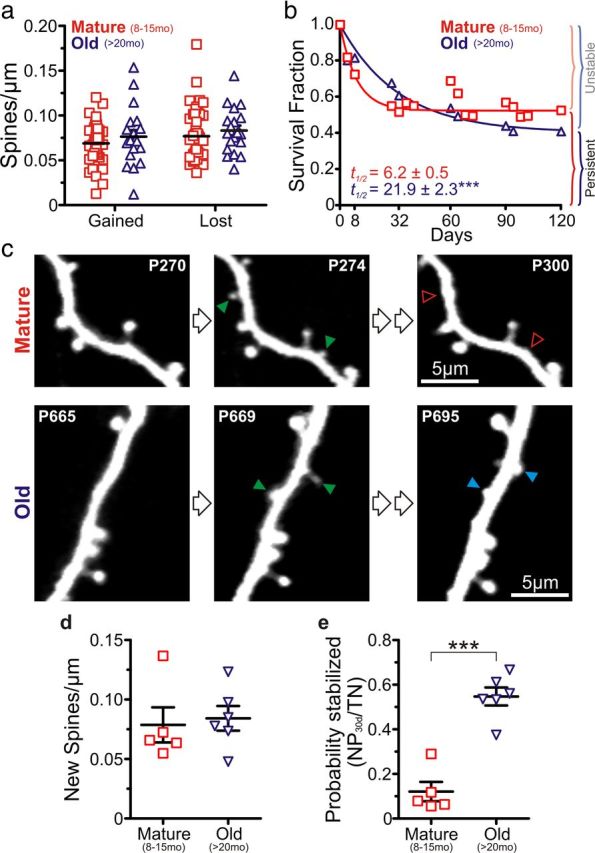
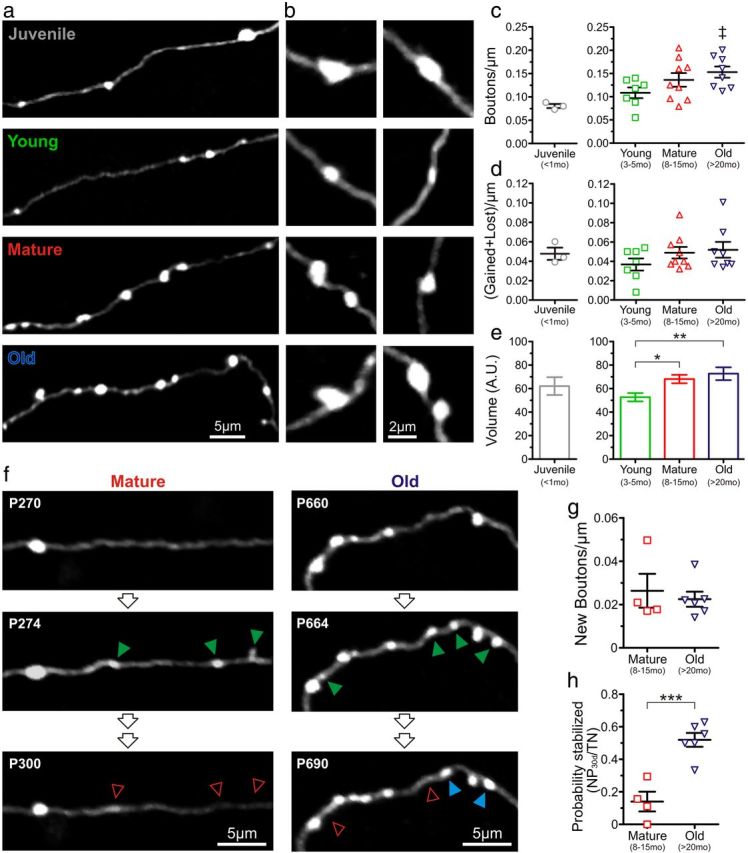
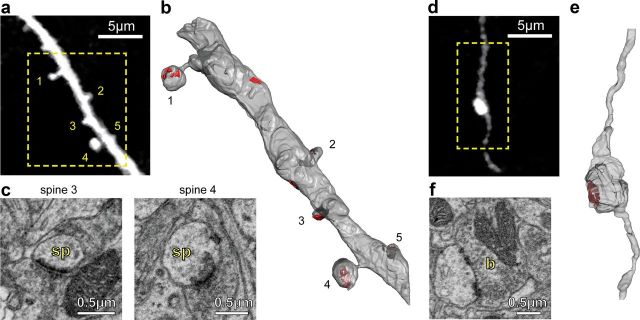
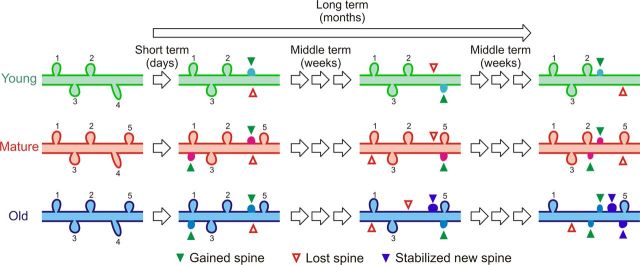
What is the neuroanatomical basis for the decline in brain function that occurs during normal aging? Previous postmortem studies have blamed it on a reduction in spine density, though results remain controversial and spine dynamics were not assessed. We used chronic in vivo two-photon imaging of dendritic spines and axonal boutons in somatosensory cortex for up to 1 year in thy1 GFP mice to test the hypothesis that aging is associated with alterations in synaptic dynamics. We find that the density of spines and en passant boutons (EPBs) in pyramidal cells increases throughout adult life but is stable between mature (8-15 months) and old (>20 months) mice. However, new spines and EPBs are two to three times more likely to be stabilized over 30 d in old mice, although the long-term retention (over months) of stable spines is lower in old animals. In old mice, spines are smaller on average but are still able to make synaptic connections regardless of their size, as assessed by serial section electron microscopy reconstructions of previously imaged dendrites. Thus, our data suggest that age-related deficits in sensory perception are not associated with synapse loss in somatosensory cortex (as might be expected) but with alterations in the size and stability of spines and boutons observed in this brain area. The changes we describe here likely result in weaker synapses that are less capable of short-term plasticity in aged individuals, and therefore to less efficient circuits.


Figures

Figure 1.
Figure 1.
Dendritic spines are more numerous, smaller, and have higher turnover in old mice than in young adult mice. a, Representative high-resolution images of apical dendritic segments from L5 pyramidal neurons (top row) acquired with in vivo two-photon microscopy 4 d apart (bottom row) in juvenile (<1 month; n = 3 mice), young (3–5 months; n = 7), mature (8–15 months; n = 11), and old (>20 months; n = 8) mice. All are best projections (3–8 slices, 1.5 μm apart). A few examples of persistent spines (yellow arrowheads), gained spines (green arrowheads), and lost spines (open red arrowheads) are shown. Postnatal day is shown in the top right corner. White arrows indicate examples of small dendritic spines that are most frequently found in old mice. b, Density of dendritic spines from L5 pyramidal neurons in juvenile (n = 8 cells), young (n = 19), mature (n = 48), and old (n = 24) mice. Given that the focus of the present investigation was the effect of aging on synapse dynamics during aging in adult mice, the juvenile group was not included in the analysis (ANOVA test) but shown separately as a reference. ***p < 0.001, Bonferroni's post hoc test. Each symbol indicates a different pyramidal cell. c, Turnover of spines (#gained + #lost spines per μm) over a period of 4 d at different ages. **p < 0.01, Bonferroni's post hoc test. Each symbol indicates a different pyramidal cell. d, Distribution of the different subtypes of dendritic spines (mushroom, thin and stubby) at different ages. e, Volume of dendritic spines in juvenile (n = 304 spines), young (n = 231), mature (n = 410), and old (n = 267) mice. **p < 0.01, Bonferroni's post hoc test. Only the average of the distribution is shown.
Figure 2.
Figure 2.
Chronic imaging over 4–12 months shows an increase in spine density between mature and old mice. a, Density of dendritic spines as a function of time (4–7 months) in mature mice. Colored lines represent individual pyramidal cells (n = 10 from 4 mice); the black line indicates the average. The horizontal dotted line indicates the average spine density at the first imaging session. b, Spine density in mature mice at the first imaging session and 120 d later. *p < 0.05, paired t test; n = 10 cells. c, Spine density as a function of time (4 months) in old mice. Lines are as in a (n = 9 cells from 4 mice). d, Spine density in old mice at the first imaging session and 120 d later. p = 0.315, paired t test; n = 9 cells. e, Time-lapse in vivo two-photon images of an apical dendritic segment taken over 12 months (encompassing the mature and old age groups). All are best projections (4–10 slices, 1.5 μm apart). White arrows indicate examples of very small dendritic spines found most frequently in old mice. f, Spine density for L5 pyramidal cells imaged over 12 months (n = 7 cells). Lines are as in a. Red shading indicates the mature stage; blue shading indicates the old stage. g, Average spine density in cells imaged over 1 year, at day 1 (mature), and at day 360 (old). *p < 0.05, paired t test, n = 7 cells.
Figure 3.
Figure 3.
Higher probability of 30 d spine stabilization but shorter long-term lifetime in old mice compared with mature mice. a, Gained and lost spines per unit length of dendrite in mature (n = 46 cells) and old (n = 24) mice (each symbol indicates a different cell). b, Average survival fraction of spines for mature (n = 36 cells) and old (n = 21) mice over a 120 d period. Half-life (t1/2) values for both groups were significantly different; ***p < 0.001, extra sum-of-squares F test. c, Representative in vivo two-photon images of apical dendritic segments from L5 pyramidal neurons depicting differences in dendritic spine stabilization between mature (top) and old (bottom) mice. All are best projections (3–5 slices, 1.5 μm apart). Green arrowheads indicate gained spines after a 4 d interval. In the mature group, most of the newly gained spines were lost 4 weeks later (open red arrowheads); however, in the old group, many of the newly gained spines were still present by that time (blue arrowheads). d, Density of new dendritic spines after a 4 d imaging interval. p = 0.759. Each symbol represents a different animal (n = 5 and 6 mice for mature and old groups, respectively, in d and e). e, Probability of stabilization of new spines over 30 d in mature and old animals. ***p < 0.001, unpaired t test.
Figure 4.
Figure 4.
Higher density and volume of en passant axonal boutons in old mice compared with young adult mice. a, Examples of in vivo two-photon images of EPBs on type A3 axons (presumably from L5 cortical pyramidal neurons) in juvenile, young, mature, and old mice. b, Additional examples of the relative size of representative EPBs at higher magnification at different ages. c, Density of EPBs at different ages. As in Figure 1, the juvenile group is shown separately as a reference. p < 0.05 young versus old mice, unpaired t test. Individual symbols represent different mice (n = 3, 7, 9, and 8 mice for the juvenile, young, mature, and old groups, respectively, in c and d). d, Turnover of EPBs (#gained + #lost spines per μm) over a period of 4 d at different ages. Individual symbols represent different mice. e, Volume of EPBs (n = 219, 405, and 267 boutons for the young, mature, and old groups, respectively) at different ages. *p < 0.05; **p < 0.01, Bonferroni's post hoc test. f, Representative in vivo two-photon images of A3 axonal segments depicting differences in EPB stabilization between mature (left) and old (right) mice. All are best projections (4–7 slices, 1.5 μm apart). Green arrowheads indicate gained EPBs after a 4 d interval. In the mature group, most of the newly gained EPBs were lost 4 weeks later (open red arrowheads); however, in the old group, many of the EPBs were still present by that time (blue arrowheads). g, Density of new EPBs after a 4 d imaging interval. p = 0.621; n = 4 and 6 mice for the mature and old groups, respectively, in g and h. Each symbol represents a different animal. h, Probability of stabilization of new EPBs over 30 d in mature and old animals. ***p < 0.001, unpaired t test. Each symbol represents a different animal.
Figure 5.
Figure 5.
The small spines and large EPBs of old mice make synapses. a, In vivo two-photon image of an apical dendritic segment from a L5 neuron that was subsequently reconstructed with SSEM. Note how two of the spines had small volumes. b, SSEM reconstruction of a portion of the dendrite shown in a with four spines. The areas shaded in red indicate synapses. Note that every spine, even those with very small volumes, makes asymmetric synapses. c, EM photomicrographs of spines (sp) 3 and 4 from a. d, In vivo two-photon image of an A3 axon with an EPB that was subsequently reconstructed with SSEM. e, SSEM reconstruction of a portion of the axon shown in a. The areas shaded in red represent synapses. f, EM photomicrograph of the EPB (b) from d.
Figure 6.
Figure 6.
Proposed model for changes in dendritic spine dynamics during normal aging. Based on our own and previously published data, we introduced a number of variables and conditions to the model, including density (d) [dyoung < dmaturedold], short-term (e.g., 4 d) turnover (TORst) [TORstyoung < TORstmature ≈ TORstold], half-life of unstable dendritic spines (t1/2) [t1/2youngt1/2maturet1/2old], and probability of stabilization of new spines over 30 d (PSns) [PSnsmature ≪ PSnsold]. Because L5 neurons in old mice stabilize a higher percentage of new spines than mature mice (over 30 d) without changing dendritic spine density, the overall lifetime of spines over longer periods of time is lower in the old mice, and very few of the original spines (1 and 5) are still present after several months. On the other hand, young and mature mice have a very distinct population of unstable spines, with short lifetimes and a higher percentage of spines that are persistent over the long term. Green arrowheads indicate gained spines, empty red arrowheads indicate the loss of a dendritic spine, and blue arrowheads indicate stabilized new spines. New and stabilized new spines were colored differently for better visualization. The proportional volume of spines at different ages also reflects our results.

References

    1. Achard S, Bullmore E. Efficiency and cost of economical brain functional networks. PLoS Comp Biol. 2007;3:e17. - PMC - PubMed
    1. Adams I, Jones DG. Quantitative ultrastructural changes in rat cortical synapses during early-, mid- and late-adulthood. Brain Res. 1982;239:349–363. - PubMed
    1. Anderson B, Rutledge V. Age and hemisphere effects on dendritic structure. Brain. 1996;119:1983–1990. - PubMed
    1. Benice TS, Rizk A, Kohama S, Pfankuch T, Raber J. Sex-differences in age-related cognitive decline in C57BL/6J mice associated with increased brain microtubule-associated protein 2 and synaptophysin immunoreactivity. Neuroscience. 2006;137:413–423. - PubMed
    1. Bishop D, Nikić I, Brinkoetter M, Knecht S, Potz S, Kerschensteiner M, Misgeld T. Near-infrared branding efficiently correlates light and electron microscopy. Nat Methods. 2011;8:568–570. - PubMed

Publication types

MeSH terms

Substances