. 2013 Feb 27;33(9):4128-39.
doi: 10.1523/JNEUROSCI.1421-12.2013.

Multimodal convergence within the intraparietal sulcus of the macaque monkey

Affiliations

Multimodal convergence within the intraparietal sulcus of the macaque monkey

Olivier Guipponi et al. J Neurosci. .

Abstract

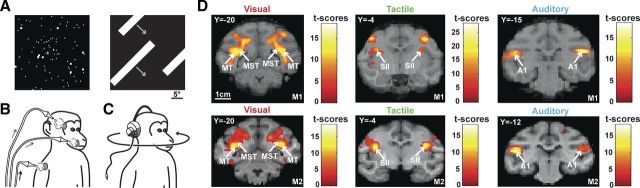
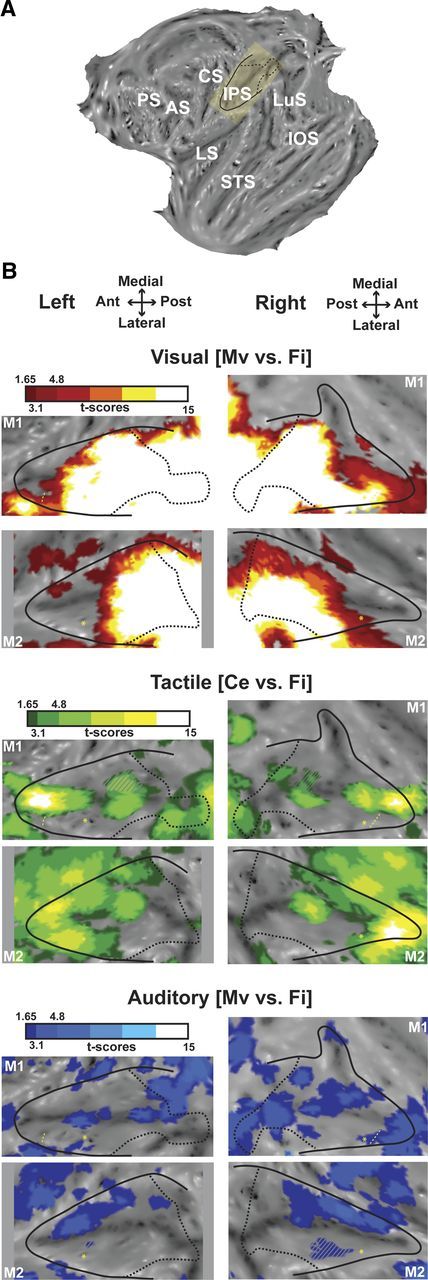
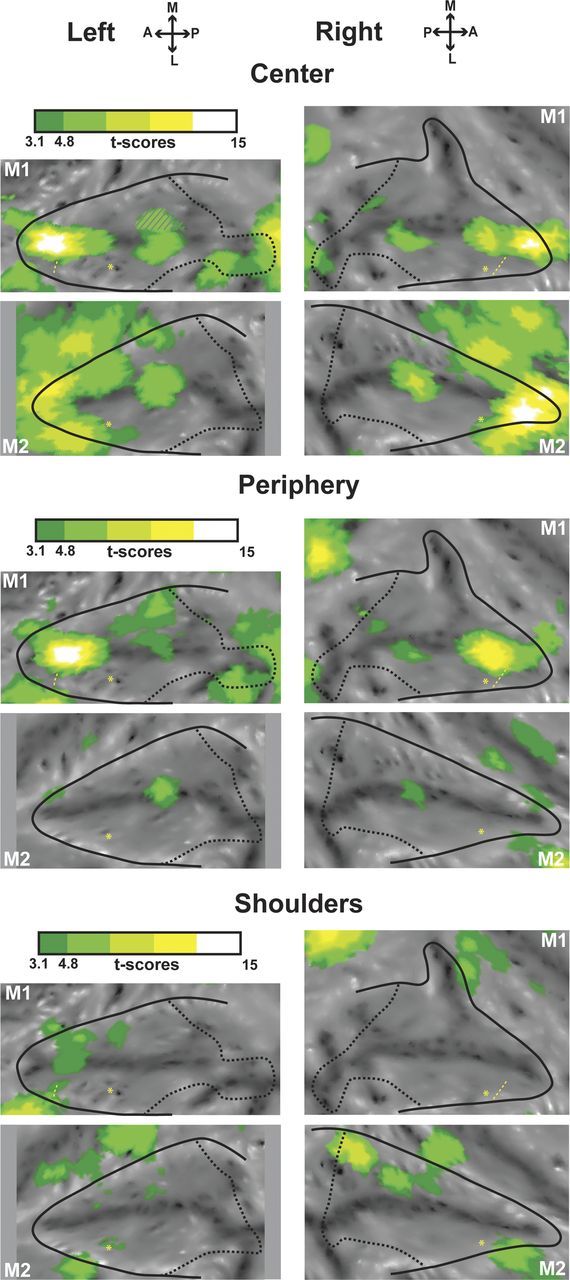
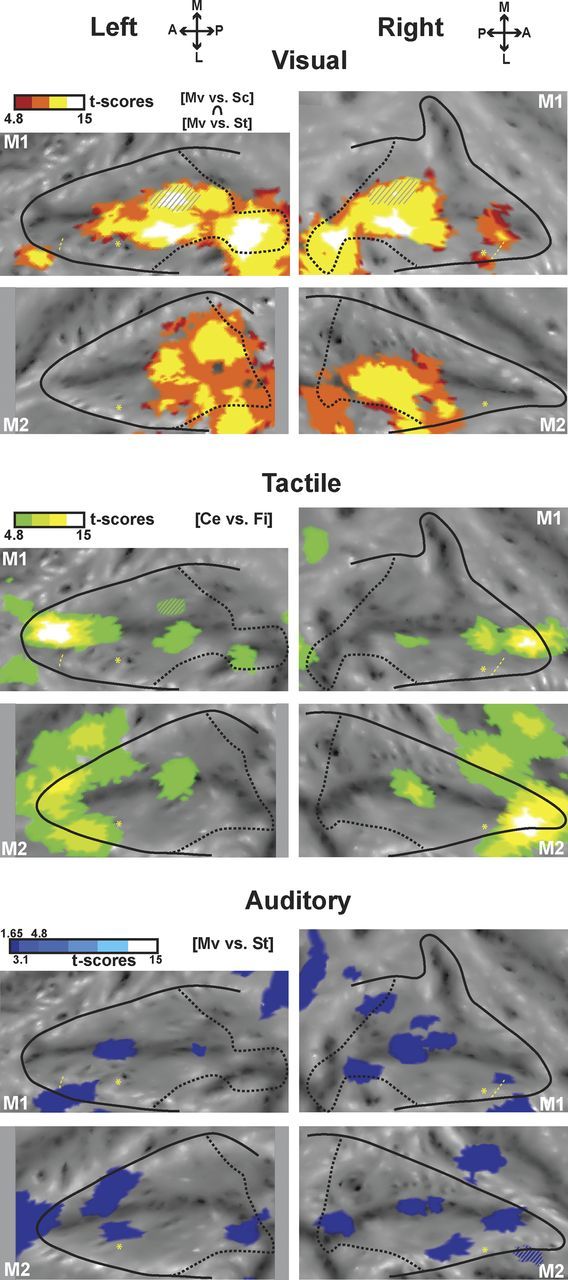
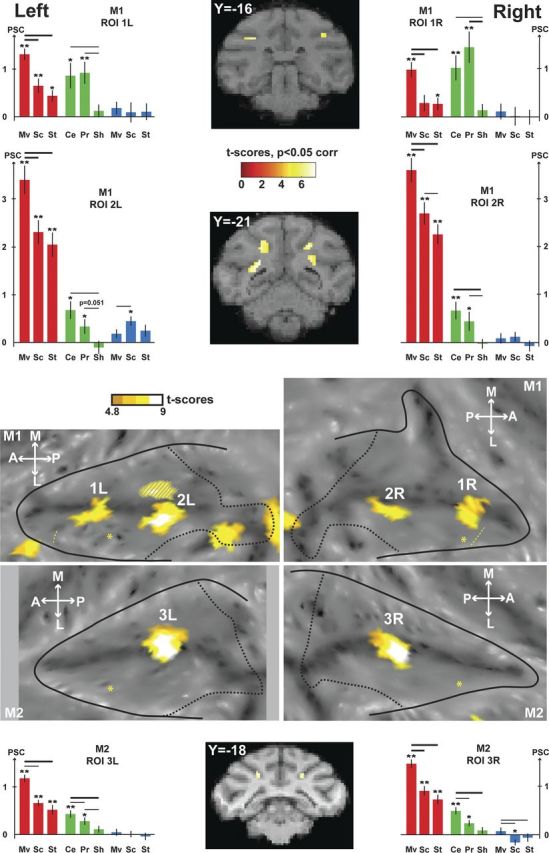
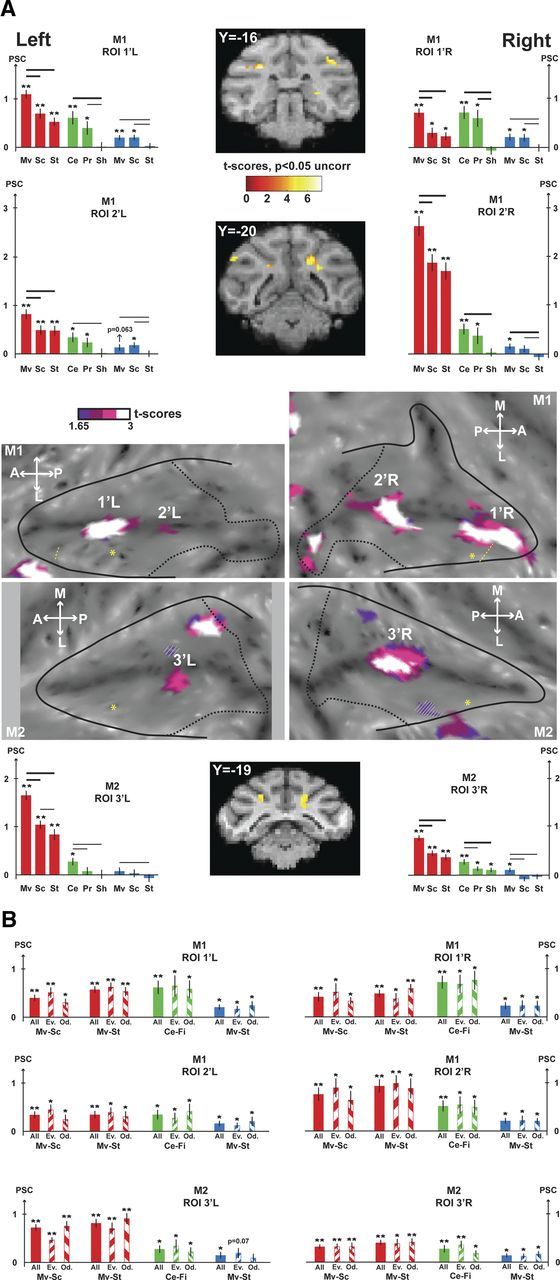
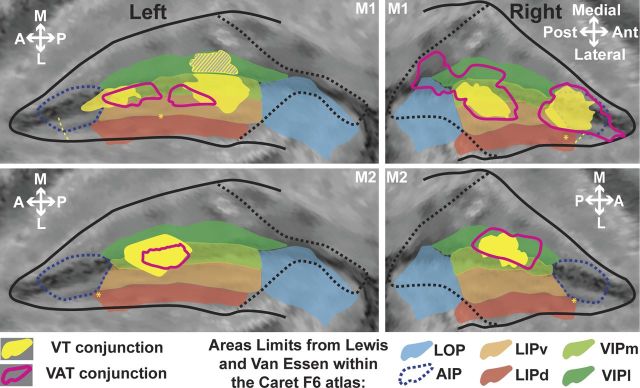
The parietal cortex is highly multimodal and plays a key role in the processing of objects and actions in space, both in human and nonhuman primates. Despite the accumulated knowledge in both species, we lack the following: (1) a general description of the multisensory convergence in this cortical region to situate sparser lesion and electrophysiological recording studies; and (2) a way to compare and extrapolate monkey data to human results. Here, we use functional magnetic resonance imaging (fMRI) in the monkey to provide a bridge between human and monkey studies. We focus on the intraparietal sulcus (IPS) and specifically probe its involvement in the processing of visual, tactile, and auditory moving stimuli around and toward the face. We describe three major findings: (1) the visual and tactile modalities are strongly represented and activate mostly nonoverlapping sectors within the IPS. The visual domain occupies its posterior two-thirds and the tactile modality its anterior one-third. The auditory modality is much less represented, mostly on the medial IPS bank. (2) Processing of the movement component of sensory stimuli is specific to the fundus of the IPS and coincides with the anatomical definition of monkey ventral intraparietal area (VIP). (3) A cortical sector within VIP processes movement around and toward the face independently of the sensory modality. This amodal representation of movement may be a key component in the construction of peripersonal space. Overall, our observations highlight strong homologies between macaque and human VIP organization.


Figures

Figure 1.
Figure 1.
Stimulations for the three sensory modalities and their corresponding primary activations. A, Two examples of visual stimuli: coherent optic flows and moving bars. The main condition of interest, coherent movement, was mixed with two control conditions (scrambled and static stimulations) and a baseline condition (fixation only). B, Schematics of the tactile stimulations: air puffs were delivered to the center of the face, the periphery of the face, or the shoulders, both on the left and right sides of the monkeys. C, Schematics of the auditory stimulations: moving sounds were delivered to the monkeys via a headset. We used the same conditions as for the visual modality. D, Statistical parametric maps (SPMs) showing the primary activations obtained for the three sensory modalities. The visual activations (left column) are specific for visual motion and correspond to the conjunction analysis of two contrasts (coherent movement vs scrambled and coherent movement vs static; p < 0.05, FWE-corrected level, masked to display only positive signal change relative to the fixation baseline). The tactile activations (middle column) correspond to stimulations to the center of the face relative to the fixation baseline (p < 0.05, FWE-corrected level). The auditory activations (right column) correspond to coherent movement relative to the fixation baseline (p < 0.05, FWE-corrected level). These results are presented individually for each monkey and displayed on coronal sections of each anatomy (M1 for the top, and M2 for the lower ones). MT, Medial temporal area; MST, medial superior temporal area; SII, secondary somatosensory area; A1, primary auditory area.
Figure 2.
Figure 2.
Visual, tactile, and auditory modalities within the intraparietal sulcus. A, Localization of the IPS on the flattened representation of the cortex obtained with Caret (monkey M1, left hemisphere). The yellow inset corresponds to the IPS, which was slightly rotated to be depicted as horizontal in B and in the following figures. Black solid line indicates the limit between the convexity and the banks of the IPS; and black dashed line, projection on the flat map of the most posterior coronal section of the IPS, just before the annectant gyrus can be identified. AS, Arcuate sulcus; CS, central sulcus; IOS, inferior occipital sulcus; IPS, intraparietal sulcus; LS, lateral sulcus; LuS, lunate sulcus; PS, principal sulcus; STS, superior temporal sulcus. B, Activations presented on the flattened IPS for (1) the visual modality (top panels), showing the coherent movement versus fixation contrast (red represents t score scale, color transitions being adjusted to t scores = 1.65 at p < 0.05, uncorrected level; t scores = 3.1 at p < 0.001, uncorrected level and t scores = 4.8 at p < 0.05, FWE-corrected level); (2) the tactile modality (middle panels), showing the center of the face versus fixation contrast (green color t score scale, color transitions as in 1); and (3) the auditory modality (lower panels), showing the coherent movement versus fixation contrast (blue represents t score scale, color transitions as in 1). The hyphenated yellow line corresponds to the anterior boundary of M1 eye movements' regressors extracted from the visual analysis. This limit corresponds to the anterior boundary of the LIP (Durand et al., 2007); nothing reliable was obtained in M2. Yellow asterisk indicates local maximal activation for the central visual field compared with the peripheral visual field, assessed with the retinotopic localizer, and corresponds to the central representation located in anterior LIP (Ben Hamed et al., 2001; Fize et al., 2003; Arcaro et al., 2011). Gray hyphenated areas represent activations spilling over the other bank of the IPS. Top (respectively lower) panels correspond to flat maps of M1 (respectively M2). A, Anterior; L, lateral; M, medial; P, posterior.
Figure 3.
Figure 3.
Tactile activations for the center of the face, periphery of the face, and shoulders presented on flap maps of the intraparietal sulcus. The center of the face (top panels for left and right sides), periphery of the face (middle panels), and shoulder (lower panels) activations correspond, respectively, to the center of the face versus fixation, periphery of the face versus fixation, and shoulder versus fixation contrasts. For other conventions, see Figure 2.
Figure 4.
Figure 4.
Motion processing regions within the intraparietal sulcus. SPMs of the visual (top panels, red scale) conjunction analysis (coherent movement vs scrambled and coherent movement vs static contrasts) are hot color-coded and displayed on the individual flat maps of the IPS (p < 0.05, FWE-corrected level, masked to display only positive signal change relative to the fixation baseline). Tactile activations (center of the face vs fixation contrast, green scale, p < 0.05, FWE-corrected level) are displayed on the middle panels. Auditory activations are displayed on the bottom (conjunction of the coherent movement vs static contrasts for the even and odd groups of runs) (test-retest analysis; p < 0.05 at uncorrected level). For other conventions, see Figure 2.
Figure 5.
Figure 5.
VT movement-specific conjunction analyses. The contrasts used for the conjunction are the visual contrasts (coherent movement vs scrambled and coherent movement vs static) and the tactile contrast (center of the face vs fixation). The activations are masked by the visual contrast (coherent movement vs fixation) so as to display only positive signal change relative to the fixation baseline. The VT conjunction (p < 0.05, FWE-corrected level) is shown on the flat maps of the two individual monkeys, and SPMs are displayed on two coronal sections in M1 and one coronal section in M2. Histograms show the PSC (mean ± SE) within the ROIs defined by the VT conjunction (1L/1R and 2L/2R for M1, 3L/3R for M2) for each individual condition of the visual runs (red: Mv, Coherent movement; Sc, scrambled; St, static), the tactile runs (green: Ce, Center of the face; Pr, periphery of the face; Sh, shoulders), and the auditory runs (blue). t tests were performed on the PSC for each condition (**p < 0.001, *p < 0.05), and in-between conditions (thick line: p < 0.001; thin line: p < 0.05). For other conventions, see Figure 2.
Figure 6.
Figure 6.
VAT movement-specific conjunction analyses. A, The contrasts used for the conjunction are the visual contrasts (coherent movement vs scrambled and coherent movement vs static), the tactile contrast (center of the face vs fixation), and the auditory contrast (coherent movement vs static). The VAT conjunction is shown at the uncorrected level (p < 0.05). The activations are masked by the visual contrast (coherent movement vs fixation) so as to display only positive signal change relative to the fixation baseline. For other conventions, see Figure 5. B, Test-retest analyses performed on VAT ROIs (1′L/1′R and 2′L/2′R for M1, 3′L/3′R for M2). For each region of interest, histograms show the PSC (mean ± SE) for the contrasts of interest used to define the VAT conjunction (visual contrasts: Mv-Sc, coherent movement vs scrambled; Mv-St, coherent movement vs static; tactile contrasts: Ce-Fi, center of the face vs fixation; auditory contrast: Mv-St, coherent movement vs static). For each sensory modality and each contrast, PSC of the whole dataset (full colored bars) and even/odd subsets (135°/45° hatched colored bars) are presented. t tests were performed on the PSC for each condition (**p < 0.001; *p < 0.05).
Figure 7.
Figure 7.
Projection of the VT and VAT conjunction results onto the F6 Caret atlas. Only the activations at the fundus of the IPS are represented. The boundaries of relevant IPS subdivisions as defined in the F6 atlas from Lewis and Van Essen (2000a, 2000b) are color shaded. See main text for a discussion of the boundaries of the AIP (dotted blue lines). For other conventions, see Figure 2.

Similar articles

Cited by

References

    1. Akbarian S, Grüsser OJ, Guldin WO. Corticofugal connections between the cerebral cortex and brainstem vestibular nuclei in the macaque monkey. J Comp Neurol. 1994;339:421–437. - PubMed
    1. Andersen RA, Cui H. Intention, action planning, and decision making in parietal-frontal circuits. Neuron. 2009;63:568–583. - PubMed
    1. Arcaro MJ, Pinsk MA, Li X, Kastner S. Visuotopic organization of macaque posterior parietal cortex: a functional magnetic resonance imaging study. J Neurosci. 2011;31:2064–2078. - PMC - PubMed
    1. Avillac M, Denève S, Olivier E, Pouget A, Duhamel JR. Reference frames for representing visual and tactile locations in parietal cortex. Nat Neurosci. 2005;8:941–949. - PubMed
    1. Avillac M, Ben Hamed S, Duhamel JR. Multisensory integration in the ventral intraparietal area of the macaque monkey. J Neurosci. 2007;27:1922–1932. - PMC - PubMed

Publication types

MeSH terms

LinkOut - more resources