. 2013 Feb 27;33(9):4140-50.
doi: 10.1523/JNEUROSCI.3712-12.2013.

Mechanistic and structural determinants of NMDA receptor voltage-dependent gating and slow Mg2+ unblock

Affiliations

Mechanistic and structural determinants of NMDA receptor voltage-dependent gating and slow Mg2+ unblock

Richard J Clarke et al. J Neurosci. .

Abstract

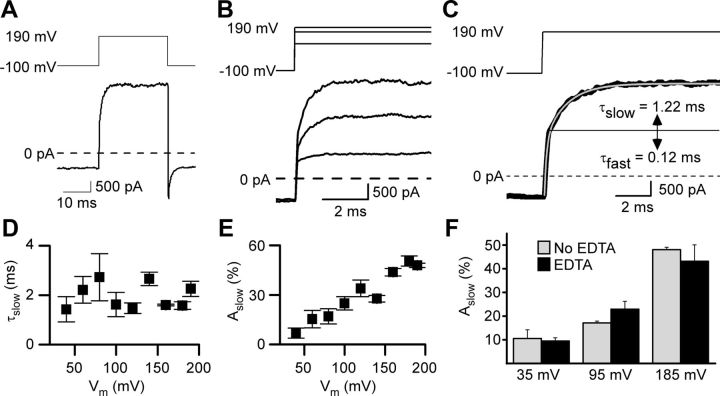
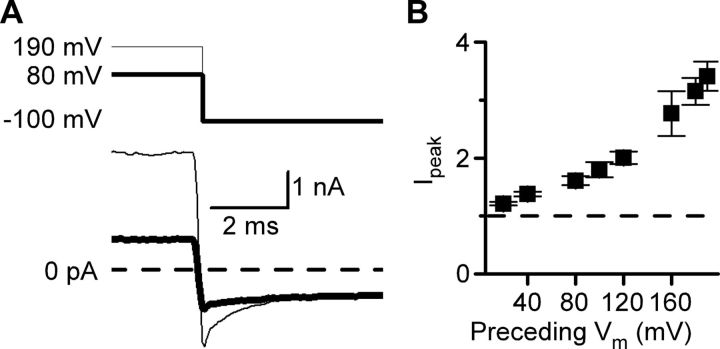
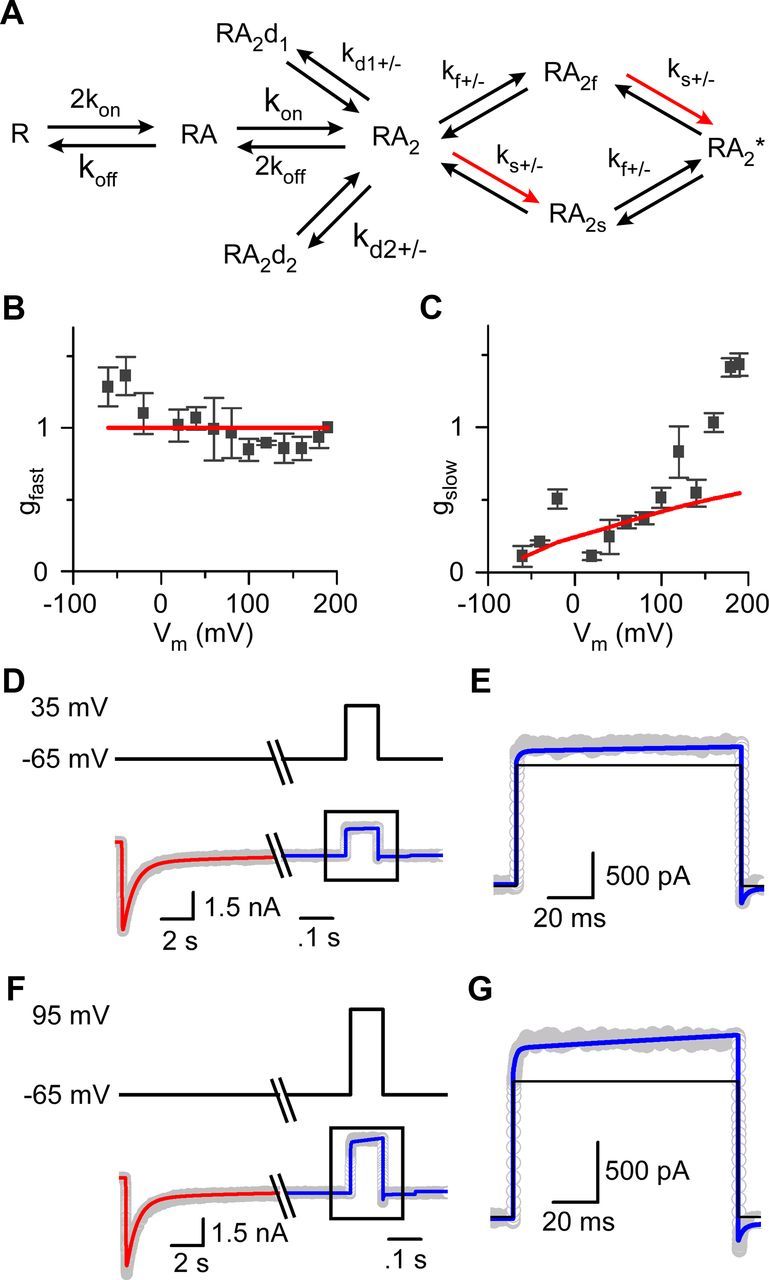
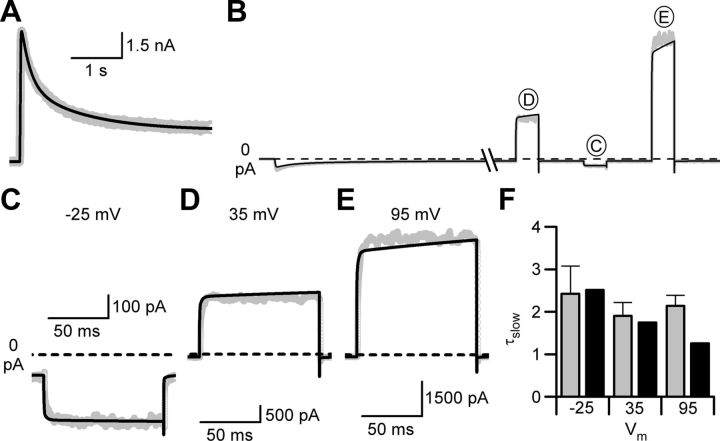
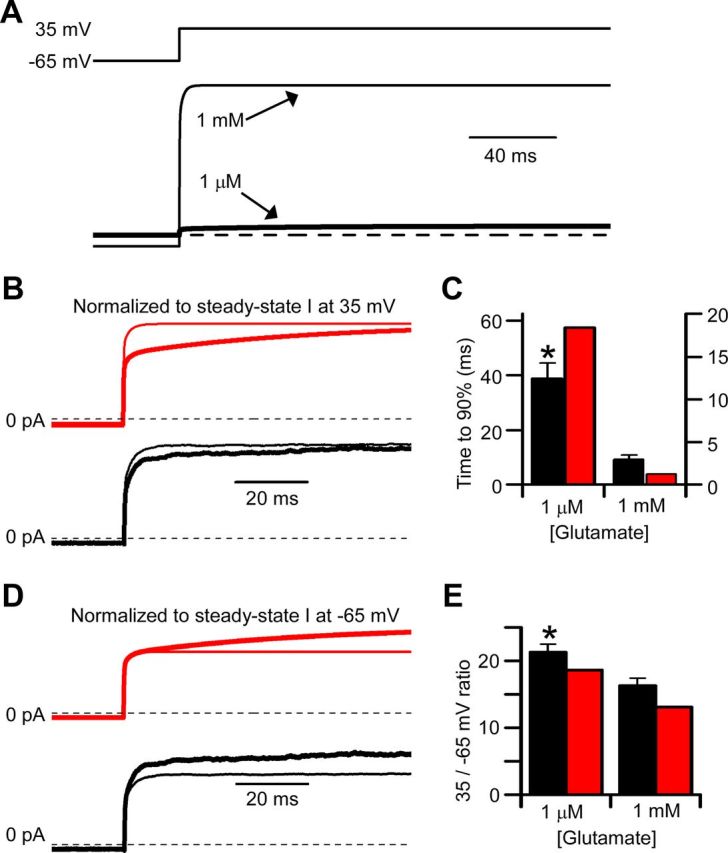
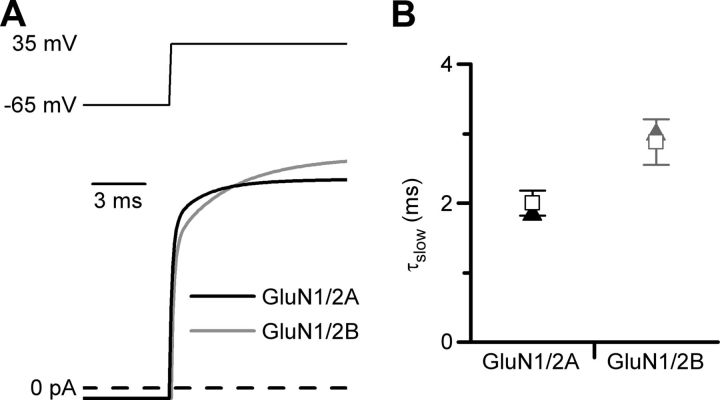
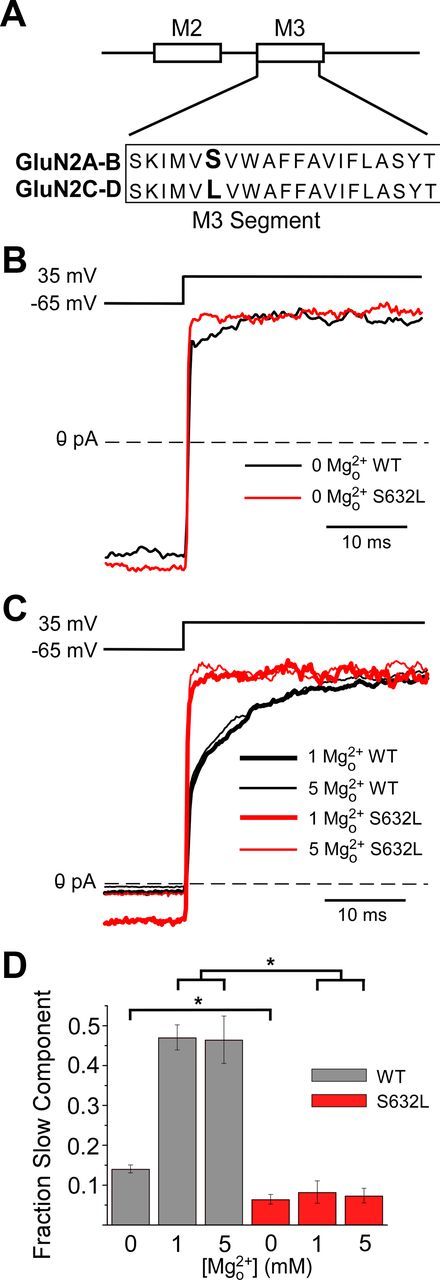
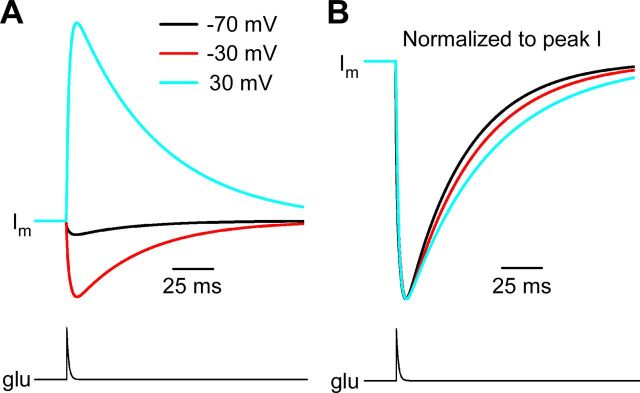
NMDA receptor (NMDAR)-mediated currents depend on membrane depolarization to relieve powerful voltage-dependent NMDAR channel block by external magnesium (Mg(o)(2+)). Mg(o)(2+) unblock from native NMDARs exhibits a fast component that is consistent with rapid Mg(o)(2+) -unbinding kinetics and also a slower, millisecond time scale component (slow Mg(o)(2+) unblock). In recombinant NMDARs, slow Mg(o)(2+) unblock is prominent in GluN1/2A (an NMDAR subtype composed of GluN1 and GluN2A subunits) and GluN1/2B receptors, with slower kinetics observed for GluN1/2B receptors, but absent from GluN1/2C and GluN1/2D receptors. Slow Mg(o)(2+) unblock from GluN1/2B receptors results from inherent voltage-dependent gating, which increases channel open probability with depolarization. Here we examine the mechanisms responsible for NMDAR subtype dependence of slow Mg(o)(2+) unblock. We demonstrate that slow Mg(o)(2+) unblock from GluN1/2A receptors, like GluN1/2B receptors, results from inherent voltage-dependent gating. Surprisingly, GluN1/2A and GluN1/2B receptors exhibited equal inherent voltage dependence; faster Mg(o)(2+) unblock from GluN1/2A receptors can be explained by voltage-independent differences in gating kinetics. To investigate the absence of slow Mg(o)(2+) unblock in GluN1/2C and GluN1/2D receptors, we examined the GluN2 S/L site, a site responsible for several NMDAR subtype-dependent channel properties. Mutating the GluN2 S/L site of GluN2A subunits from serine (found in GluN2A and GluN2B subunits) to leucine (found in GluN2C and GluN2D) greatly diminished both voltage-dependent gating and slow Mg(o)(2+) unblock. Therefore, the residue at the GluN2 S/L site governs the expression of both slow Mg(o)(2+) unblock and inherent voltage dependence.


Figures

Figure 1.
Figure 1.
GluN1/2A receptor current relaxations after depolarizing steps display a slow component in 0 Mgo2+. A, Whole-cell current recording from an HEK 293T cell-expressing GluN1/2A receptors during application of 1 mm glutamate and 10 μm glycine in 0 Mgo2+. After the inward current response (bottom trace) reached a steady-state level, a depolarizing step from −100 to 190 mV (top trace) was applied. Leak and capacitive currents were subtracted in all figures. B, Voltage steps (top traces) and current responses (bottom traces) from the cell used for A with expanded time base during depolarizations from −100 to 80, 160, and 190 mV. C, Voltage step (top trace) and current response (bottom trace, thick line) replotted from A with a double-exponential fit (bottom trace, thin gray line) superimposed. Time constants of fast and slow components of the current relaxation are given; slow component of the current trace appears above the solid horizontal line. D, τslow did not depend significantly on the voltage during the depolarizing step (based on least-squares linear regression, p = 0.80) nor did τfast (p = 0.46; data not shown). E, Aslow as a percentage of the amplitude of the entire current relaxation induced by the depolarizing step increased with depolarization. F, Addition of 10 μm EDTA to normal external solution (No EDTA) did not affect Aslow significantly (p > 0.25 at each voltage; n = 3 for each condition) after depolarizing steps from −105 mV to 35, 95, or 185 mV.
Figure 2.
Figure 2.
Amplitude of tail currents after repolarizations in 0 Mgo2+ depend on voltage preceding the repolarization. A, Currents elicited by the application of 1 mm glutamate and 10 μm glycine in 0 Mgo2+ (bottom traces) during repolarization (top traces) from 90 mV (thick line) or 190 mV (thin line) to −100 mV. Immediately after repolarization to −100 mV, the current was transiently more negative than the steady-state current measured at −100 mV. B, Ipeak, the peak inward current following repolarization to −100 mV normalized to the steady-state current at −100 mV, plotted as a function of the voltage that preceded the repolarization. Ipeak depended significantly on the voltage during the preceding depolarization (one-way ANOVA; p < 0.0001).
Figure 3.
Figure 3.
Depolarization-induced slow relaxations in 0 Mgo2+ can be reproduced by a GluN1/2A receptor model that incorporates voltage-dependent gating. A, Kinetic model used to simulate GluN1/2A receptor activation. Red arrows indicate rate that was altered to undergo an e-fold acceleration per 175 mV depolarization. B, C, Amplitudes of each component of double-exponential fits to current relaxations during depolarizing voltage steps (Fig. 1C) were converted to conductances (see Materials and Methods). gfast (B) and gslow (C) derived from fits to whole-cell data are plotted as a function of the voltage during the depolarizing voltage step (symbols). The corresponding values of gfast (B) and gslow (C) derived from GluN1/2AV-D model simulations also are plotted (red lines). D, Current trace (bottom, gray) during application of 1 mm glutamate in 10 μm glycine at −65 mV. Once a steady-state response was reached, the cell was depolarized to 35 mV. Results of fitting the GluN1/2AV-D model to determine desensitization rate constants and number of receptors (red line) and subsequent current simulations with all rates fixed (blue line) are overlaid. Voltage is shown by top trace. E, Enlarged view of the current trace (gray) and simulation by the GluN1/2AV-D model (blue line) in response to a depolarization from −65 to 35 mV. Current simulation from a model containing no voltage dependence is overlaid (black line); in this model, ks+ at all voltages equals the value measured by Erreger et al. (2005) at −100 mV. F, G, Same as D and E except the depolarization was from −65 to 95 mV.
Figure 4.
Figure 4.
Slow Mgo2+ unblock is reproduced by the GluN1/2AV-D model. A, Current trace (gray line) during application of 1 mm glutamate in 10 μm glycine and 1 mm Mgo2+ at 35 mV. The GluN1/2AV-D model, expanded to incorporate symmetric block by Mgo2+, was fit to the data with desensitization rates and channel number the only free parameters (black line). B, Experimental data (gray line) and current simulations (black line) during application of 1 mm glutamate in 10 μm glycine and 1 mm Mgo2+ at −65 mV. Once a steady-state response was reached, the cell was depolarized from −65 mV to 35, −25, and 95 mV. All model parameters were fixed during the simulation. C–E, Enlarged views of current traces (gray lines) and GluN1/2AV-D model simulations (black lines) in response to depolarizations from −65 to −25 mV (C), 35 mV (D), and 95 mV (E). F, Comparison of τslow values from whole-cell recordings (gray) and from fits to currents simulated by the GluN1/2AV-D model (black) during current relaxations activated by depolarizing steps from −65 mV to −25, 35, and 95 mV.
Figure 5.
Figure 5.
Agonist concentration dependence of slow Mgo2+ unblock is reproduced by the GluN1/2AV-D model. A, Currents (bottom traces) simulated with the GluN1/2AV-D model in 1 mm (thin line) or 1 μm (thick line) glutamate in response to a voltage jump from −65 to 35 mV (top trace) in 1 mm Mgo2+. B, D, Simulated (red lines) and recorded (black lines) currents in low (1 μm glutamate; thick line) and high (1 mm glutamate; thin lines) agonist concentration. B, Currents normalized so that the steady-state current at 35 mV in 1 μm and in 1 mm glutamate were equal; the currents at −65 mV differed slightly, although the differences are not visible in the figure. The slower approach to steady-state current at 35 mV in 1 μm glutamate reflects slower Mgo2+ unblock in low agonist concentration. C, Comparison of time required for recorded (black bars) and simulated (red bars) currents to reach 90% of their final value in low (left) and high (right) agonist concentrations. Left y-axis applies to data in 1 μm glutamate; right y-axis applies to data in 1 mm glutamate. D, Currents normalized so that the steady-state current at −65 mV (before the voltage step) in 1 μm and in 1 mm glutamate were equal. The greater outward current at 35 mV in 1 μm glutamate illustrates stronger voltage dependence of Mgo2+ inhibition in low agonist concentration. E, Comparison of absolute value of the ratio of steady-state current at 35 mV divided by steady-state current at −65 mV for recorded (black bars) and simulated (red bars) currents in low (left) and high (right) agonist concentrations. *Significantly (p < 0.05) different from corresponding value for recorded current in 1 mm glutamate.
Figure 6.
Figure 6.
Differences in gating kinetics lead to differences in Mgo2+ unblocking kinetics of GluN1/2A and GluN1/2B receptors. A, Current simulations from the GluN1/2AV-D (black) and GluN1/2BV-D (gray) models in response to a voltage jump from −65 to 35 mV in 1 mm glutamate and 1 mm Mgo2+ (glycine sites are assumed always to be occupied in all simulations). Simulations are taken from Figure 4D for GluN1/2A and from Figure 6B of Clarke and Johnson (2008) for GluN1/2B. B, Values of τslow measured from current simulations based on the GluN1/2AV-D and GluN1/2BV-D models (triangles) were in excellent agreement with τslow values measured from experimental recordings from GluN1/2A and GluN1/2B receptors (open squares), respectively. Experimental values were compiled from all of our experiments in which voltage jumps from −65 to 35 mV were performed in 1 mm glutamate, 10 μm glycine, and 1 mm Mgo2+: GluN1/2A receptor values (n = 12) are derived from experiments performed in this study and from Clarke and Johnson (2006); GluN1/2B receptor values (n = 9) are derived from Clarke and Johnson (2006), .
Figure 7.
Figure 7.
Control by a single divergent GluN2 subunit residue of voltage-dependent gating and slow Mgo2+ unblock. A, GluN2 S/L site (residues shown in bold) is located at the intracellular end of the M3 transmembrane region. Subunit residue numbering begins at the start methionine. The residues at the GluN2 S/L site are as follows: GluN2A(S632), GluN2B(S633), GluN2C(L643), and GluN2D(L657). B, Examples of GluN1/2A (WT; black line) and GluN1/2A(S632L; red line) current traces recorded from transfected tsA cells during depolarizing step from −65 to 35 mV in 30 μm NMDA and 10 μm glycine with 0 Mgo2+. C, Same as in B except in the presence of 1 or 5 mm Mgo2+. Currents in B and C were normalized to steady-state current at 35 mV (average current from 35–40 ms after the depolarizing step). D, Fractional amplitude of the slow component of current relaxations for GluN1/2A (gray) and GluN1/2A(S632L) (red) receptors in 0, 1, and 5 mm Mgo2+ (n = 5–7 in each condition). The amplitude of the slow component measured from double-exponential fits was normalized to the total amplitude of current relaxation in response to depolarizations from −65 to 35 mV. Slow components in 0 Mgo2+ were compared using the two-tailed Student's t test; slow components in 1 and 5 mm Mgo2+ were compared using one-way ANOVA followed by Tukey post hoc comparison. *Significantly different (p < 0.001).
Figure 8.
Figure 8.
Voltage-dependent decay kinetics of synaptic currents in 1 mm Mgo2+ simulated by the GluN1/2AV-D model. A, Synaptic currents (top traces) were simulated with the GluN1/2AV-D model in 1 mm Mgo2+ at the indicated membrane voltages by applying a pulse of glutamate (bottom trace) that increased instantaneously from 0 to 1 mm and then decayed with a single-exponential time constant of 1 ms (Clements et al., 1992). B, Simulated synaptic currents were normalized to peak current to allow comparison of decay time course. Decay kinetics became slower with depolarization.

Similar articles

Cited by

References

    1. Antonov SM, Johnson JW. Permeant ion regulation of N-methyl-D-aspartate receptor channel block by Mg2+ Proc Natl Acad Sci U S A. 1999;96:14571–14576. - PMC - PubMed
    1. Antonov SM, Gmiro VE, Johnson JW. Binding sites for permeant ions in the channel of NMDA receptors and their effects on channel block. Nat Neurosci. 1998;1:451–461. - PubMed
    1. Ascher P, Nowak L. The role of divalent cations in the N-methyl-D-aspartate responses of mouse central neurones in culture. J Physiol. 1988;399:247–266. - PMC - PubMed
    1. Ascher P, Marty A, Neild TO. Life time and elementary conductance of the channels mediating the excitatory effects of acetylcholine in Aplysia neurones. J Physiol. 1978;278:177–206. - PMC - PubMed
    1. Auerbach A, Sigurdson W, Chen J, Akk G. Voltage dependence of mouse acetylcholine receptor gating: different charge movements in di-, mono- and unliganded receptors. J Physiol. 1996;494:155–170. - PMC - PubMed

Publication types

MeSH terms

LinkOut - more resources